Forum
Forum OPRR
OPRR Finance
 Specials
 On-chain Eco
 Entry
Entry
 Podcasts
 Data
Data

Glassnode Last Week (Week 6) : Did Bitcoin Hit bottom?

 Summarized by AI
Original source: GlassNode
Written by Ding HAN
As bitcoin prices rebound from multi-month lows, we investigate possible drivers and assess the quality of support offered in the $30,000 - $40,000 range.
After a three-month downward trend, the bitcoin market has enjoyed a run of gains, with the price stabilising above the psychological $40,000 level. However, in the context of numerous macro and market headwinds, is this a bottom, or just a partial bottom in a longer term bear market?
In this week's report, we will assess the fundamental support that has established the recent price lows and the various mechanisms driving the market higher. Prices have rebounded from some fundamental levels that historically mark undervalued or "fair value" prices. We also talked about last week's paperShort squeezes discussed inWhether it has been staged, and short-term holders of the market to sell the pattern of rising.
We also have some comments on the recent sale of 96,400 Bitcoins related to the 2016 Bitfinex hack, as well as how this event can be detected in various on-chain metrics.
Fundamental support
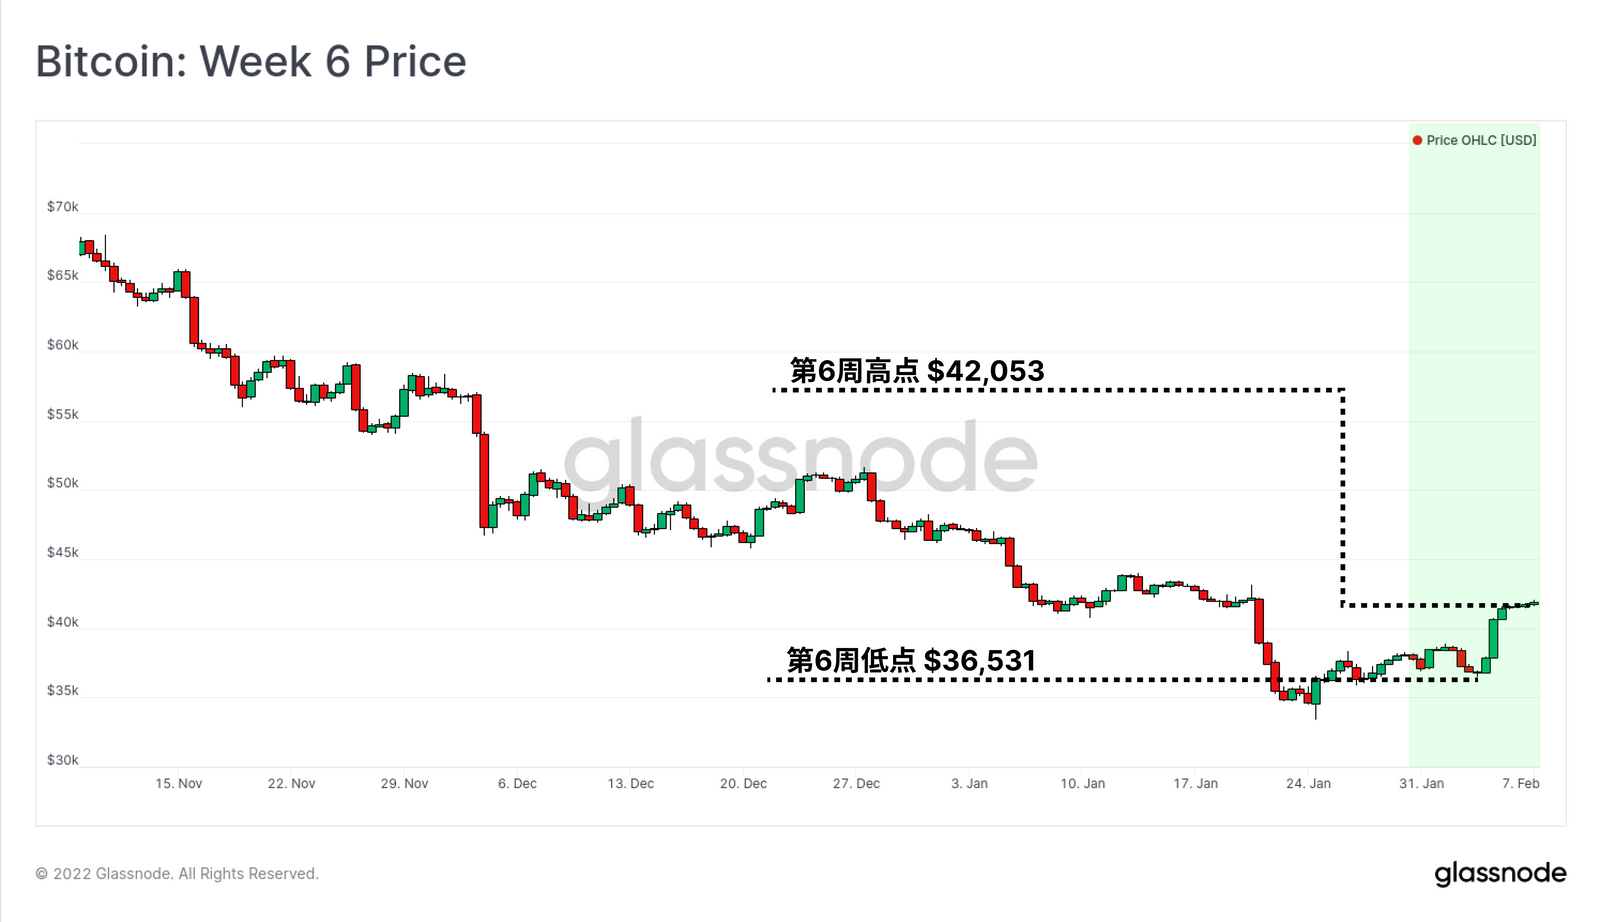
Throughout 2021 and 2022, the $30,000 to $40,000 price range has proven to be a solid support level for the bitcoin bull market. In 2021, this band was defended after a 50% + drop in May-July, provided support in a correction in September, and again in January-February this year.
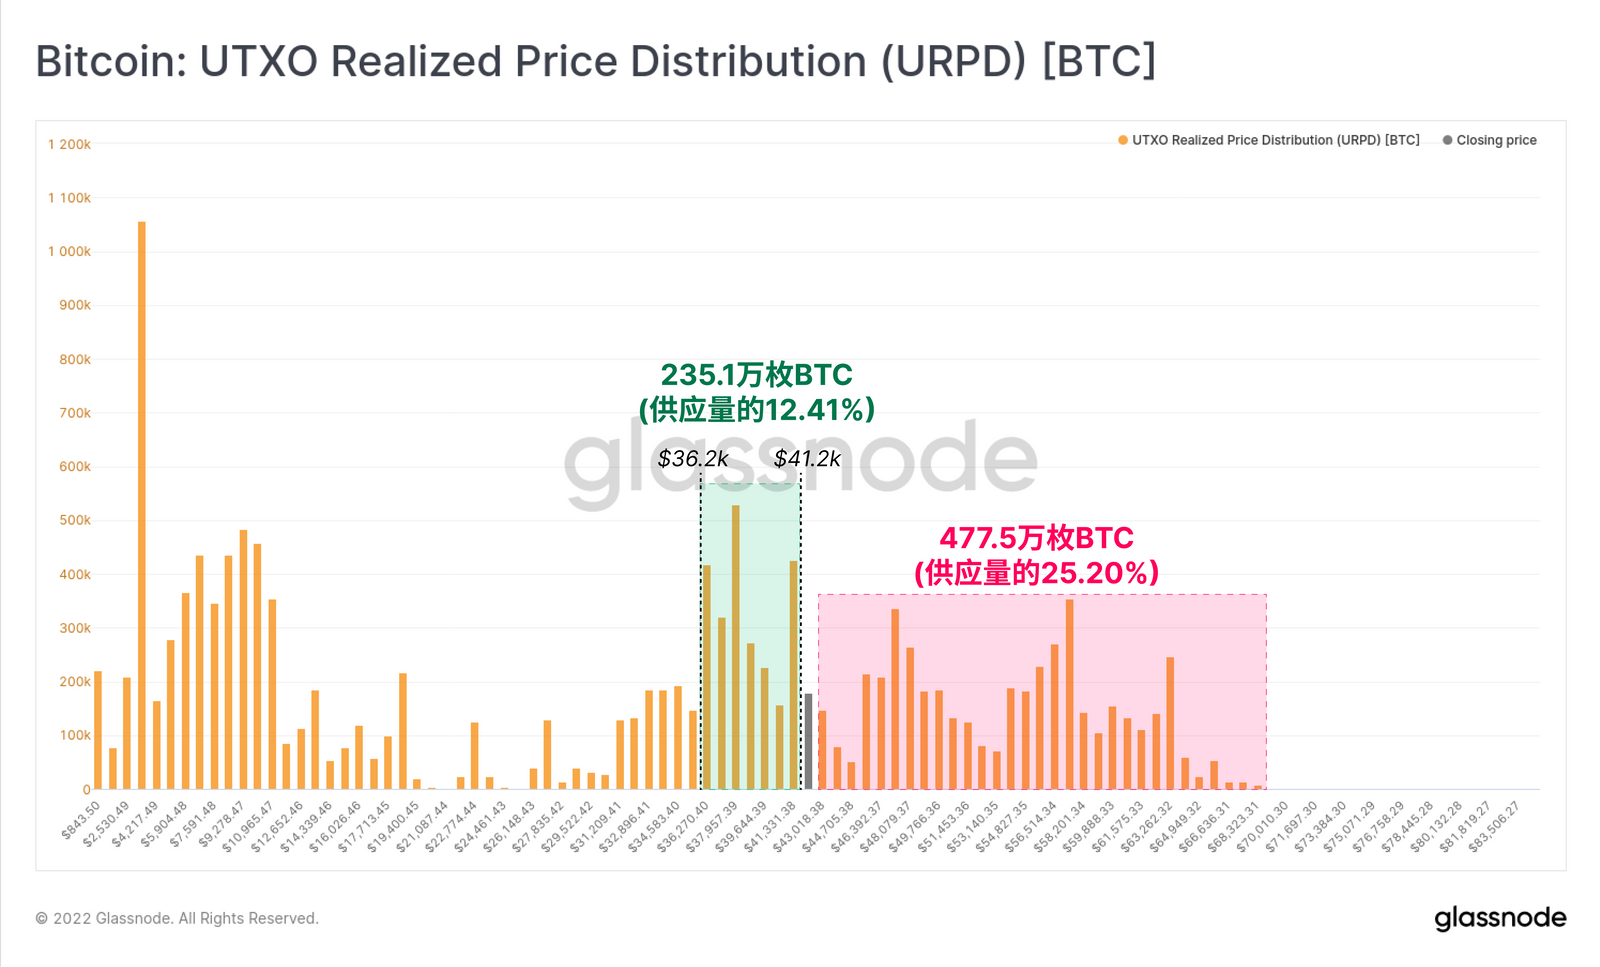
The URPD indicator shows the distribution of selling prices for the current Bitcoin UTXO set. Among the indicators, we can see that 2.351 million BTCS (12.41 per cent of supply) last traded between $36,200 and $41,200. Even when those bitcoins were resold at a lower realisation value, the market remained top-heavy, with more than 25% of the available supply closing at a higher price.
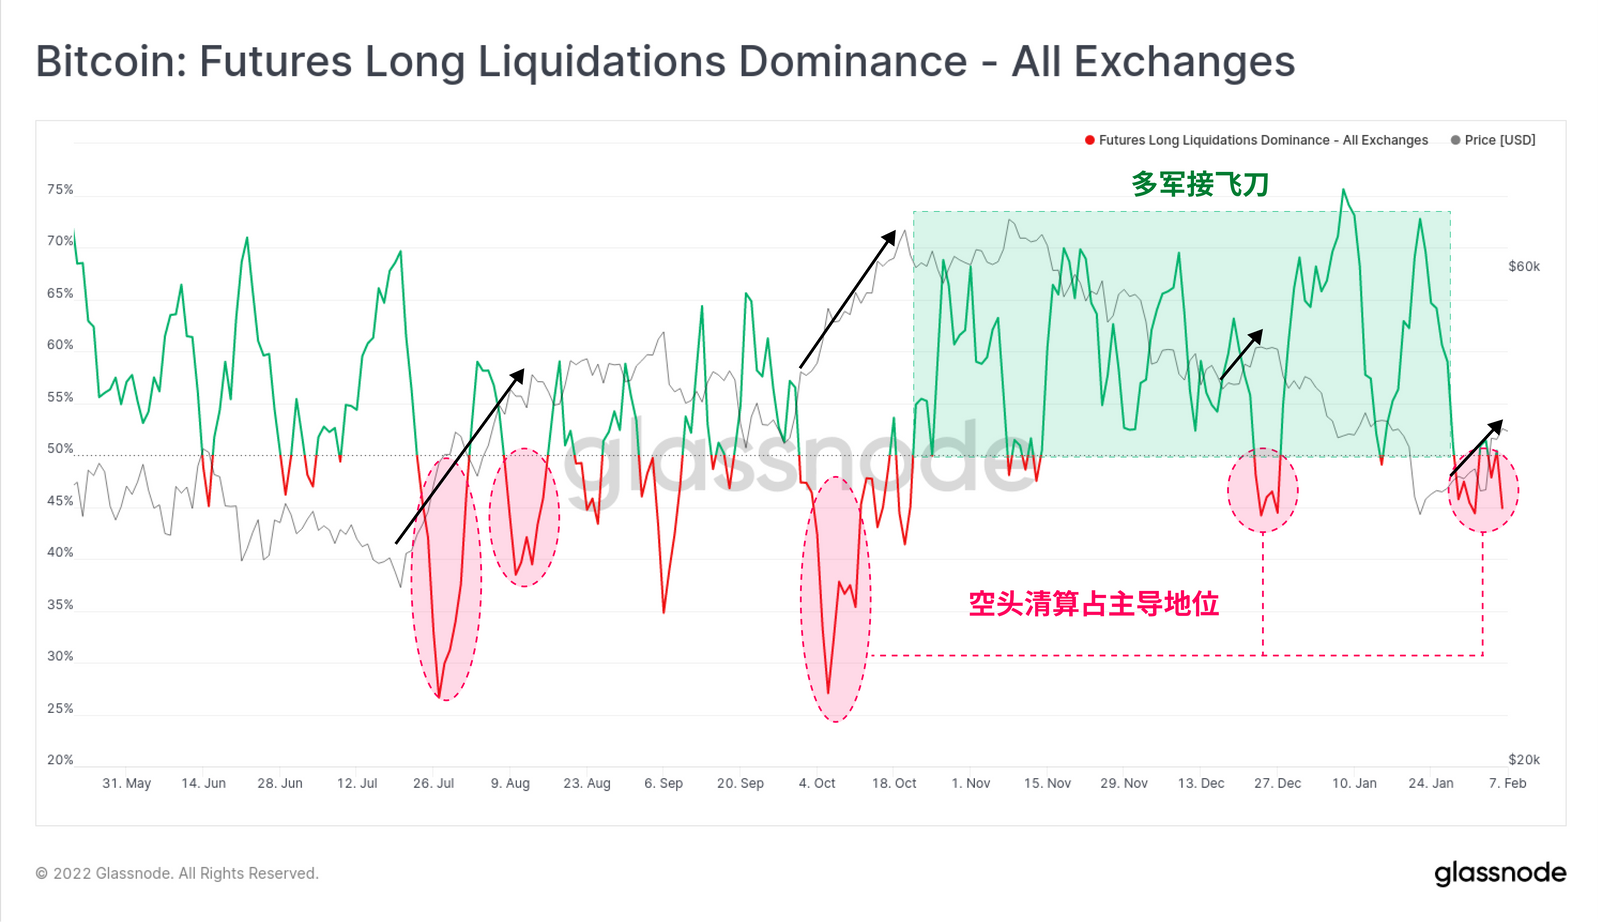
As the market moves higher, one mechanism driving it could be a short squeeze on late entry shorts that we have seen inLast week's versionHas been discussed in. The chart of long liquidation ratio shows that shorts have been on the back foot this week, slightly gaining the upper hand on the short liquidation trend.
However, the magnitude of this measure is still fairly anaemic, suggesting that price increases are unlikely to be largely driven by a short squeeze.
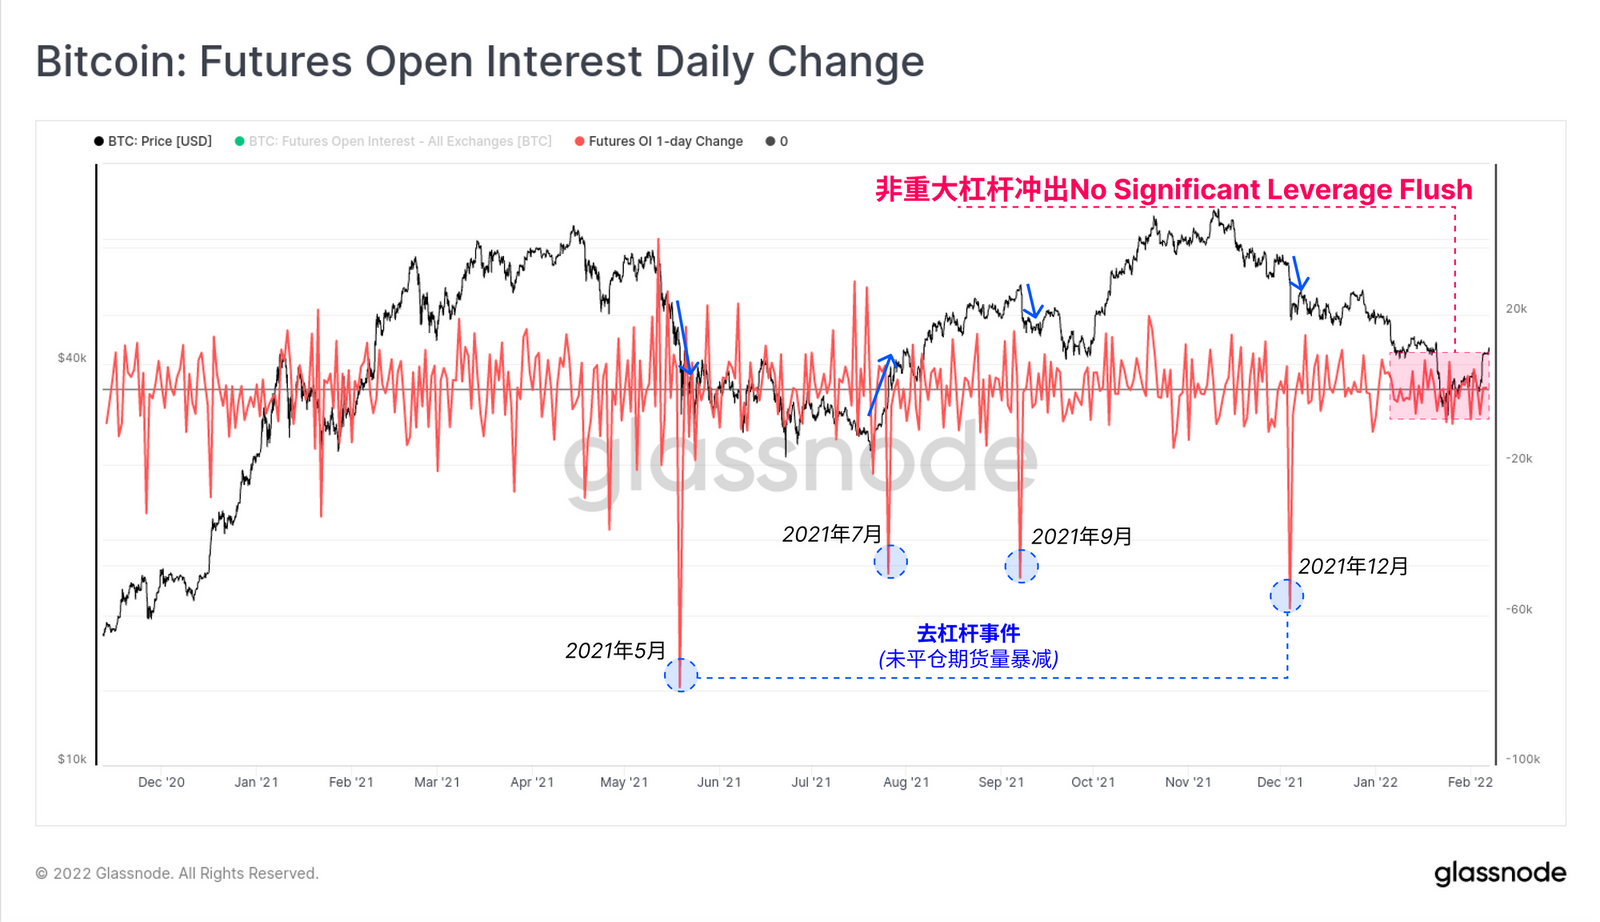
For the most part, the 1-day change in futures open interest confirms this speculation, and we have yet to see the typical feature of a deleveraging event where large amounts of open interest are forced to close. However, open interest in futures remains high at around 1.91% of bitcoin's market cap, or about $15 billion.
This could indicate that the probability of a short move is lower than originally estimated, or that such an event is still possible if the market continues to move higher and a short stop/clearing cluster is reached.
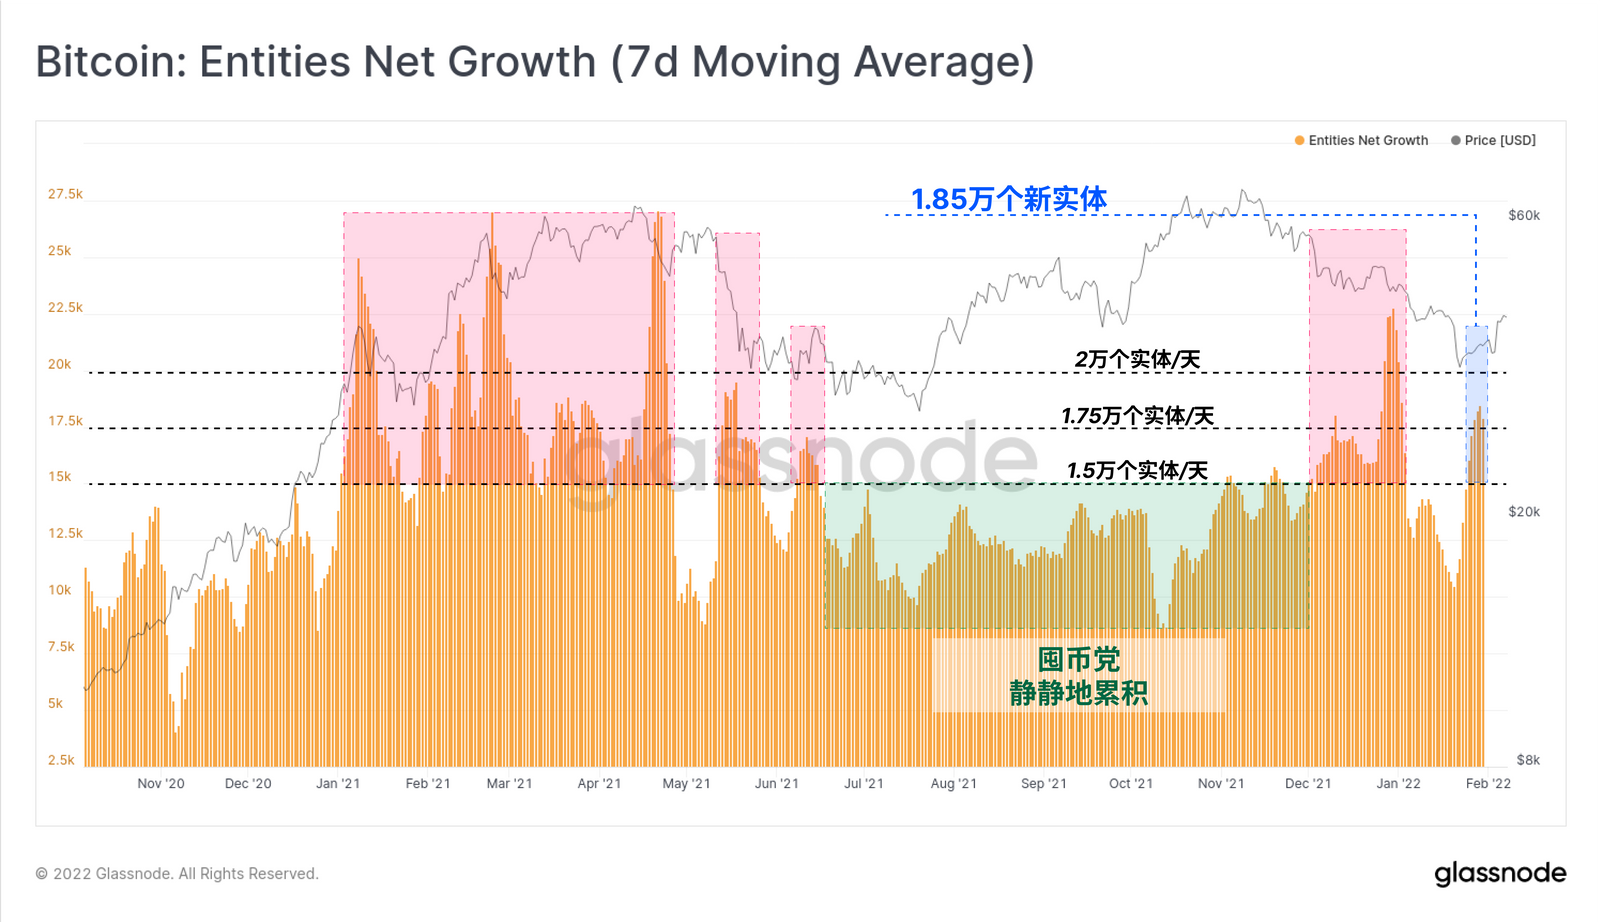
Looking ahead to the spot/on-chain market, we see a large number of new net entities added to the Bitcoin network this week, pushing up to a net gain of 18,500 entities per day. In 2021, the bulk of net entity occurred during periods of volatility, such as the bull market correction from Q1 to Q2 and the 50% + sell-off in May.
June to December 2021 was a quiet accumulation period, with 125,000 net entities entering the network each day. So the recent spike in January and February may indicate a temporary transition to hoarder-led accumulation, or at least renewed interest in Bitcoin, after trading has fallen to more attractive entry prices.
Short-term momentum upward
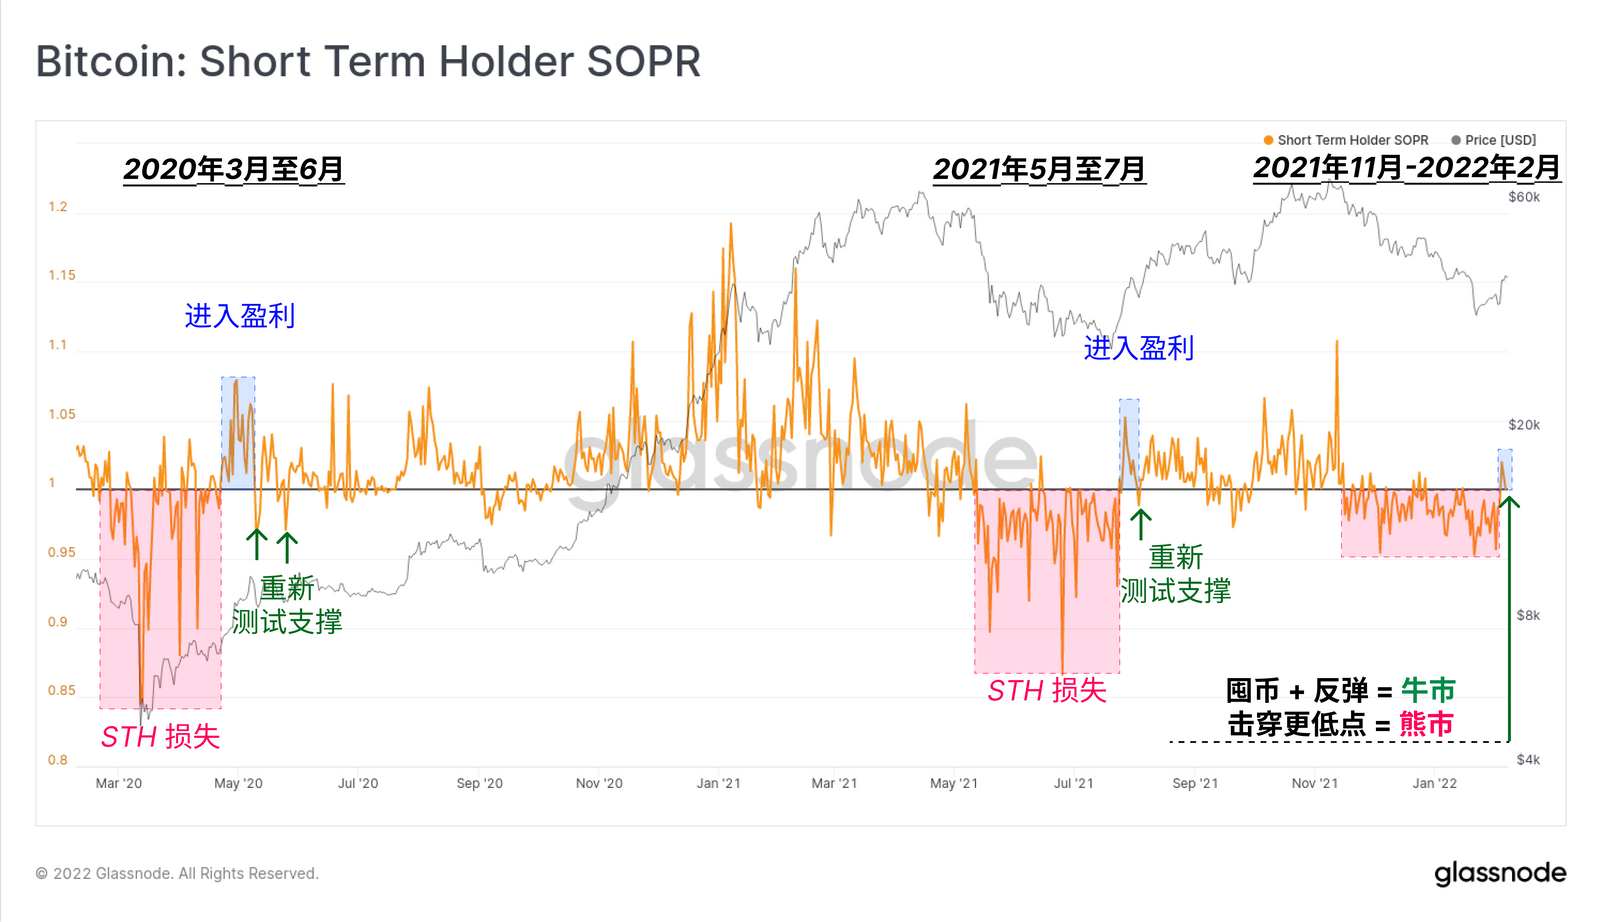
Short Term holders (STH) had their first profitable day since late November, with STH-SOPR breaking through 1.0. That suggests that bitcoins sold this week, as well as those less than 155 days old, are generally profitable. STHs, which bought at the top of the coin price, sold their bitcoin at a lower price for more than two months before that, and they realized losses every day.
Since March 2020, we can see a similar PATTERN for SSTH -SOPR in two instances. After a long period of losses, the market managed to break out of the bullish uptrend and the SX-SOPR retested 1.0. If THE SBS-SOPR index breaks again, indicating a return to profitability, demand starts to flow in and buy bitcoin. Conversely, a move back below 1.0 would be a bearish indicator and indicate that there is not enough demand to support selling pressure in STH.
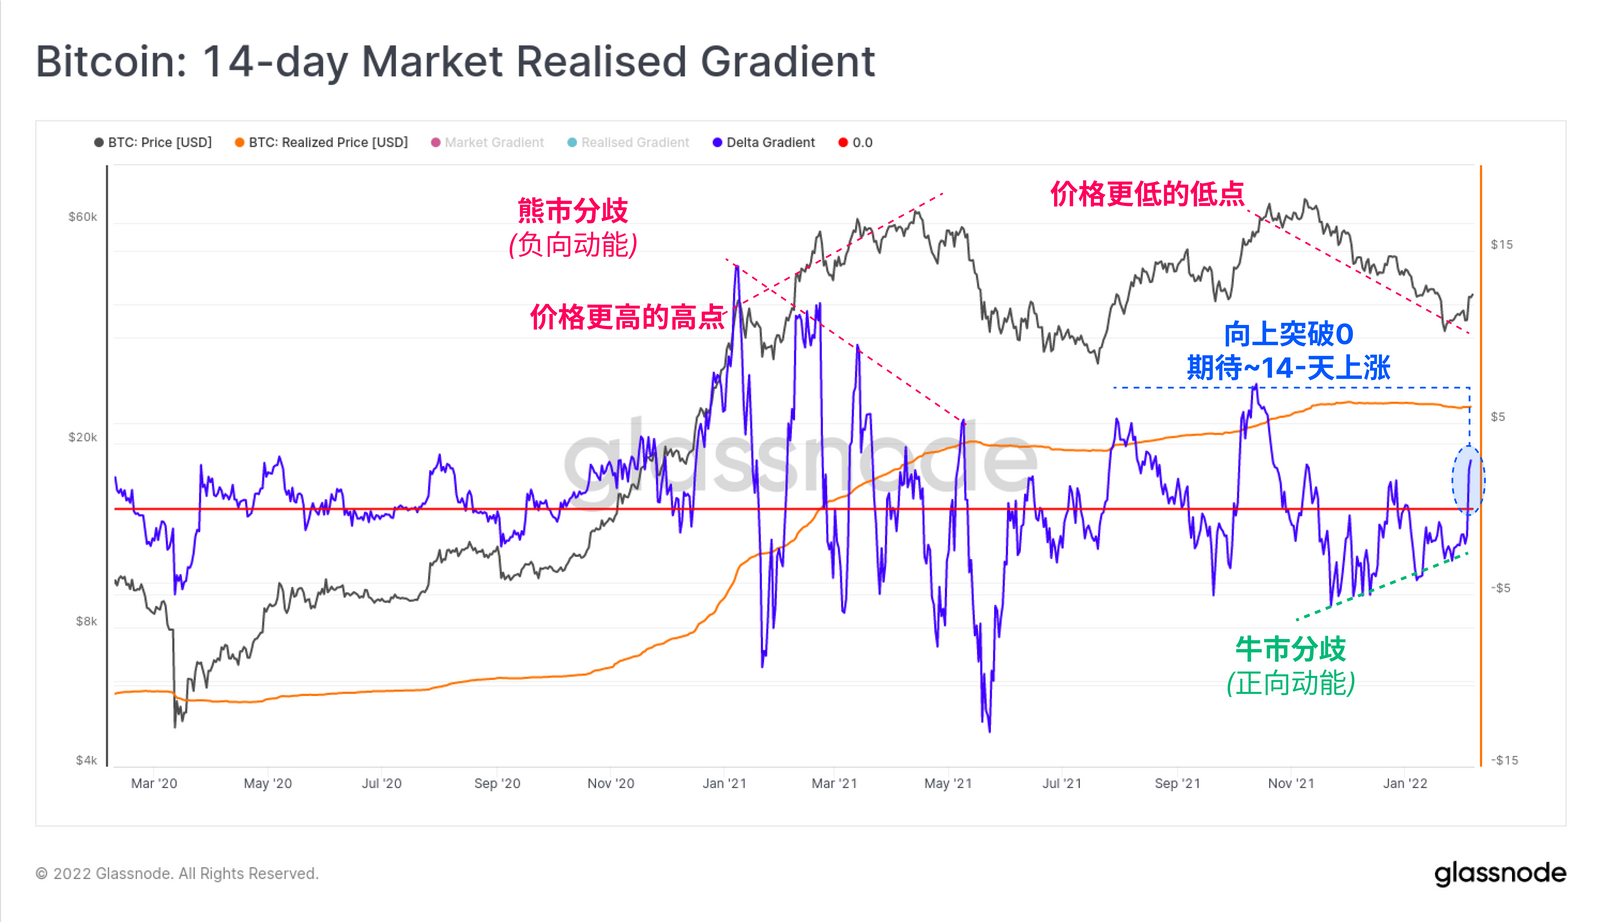
We also see a fairly striking bullish divergence on the 14-day market Realization Gradient (MRG) volatility indicator. This measure simulates the dynamics of market pricing relative to natural capital inflows and is reflected in achieving the cap. The general explanation is as follows:
• & have spent Successive high/low peaks indicate upward/downward momentum, respectively.
• & have spent A break above/below 0 indicates that the new uptrend/downtrend is in play, with approximately 14 days of volatility expected.
While the March-April 2021 market top showed a bearish divergence (market momentum drops and prices rise), the current period reflects a bullish divergence. The downward momentum has weakened with each new low and the 14-day MRG indicator is now above 0.28 days MRG indexActually shows a similar market structure, supporting the argument for at least one local market low, namely convergence and magnitude.
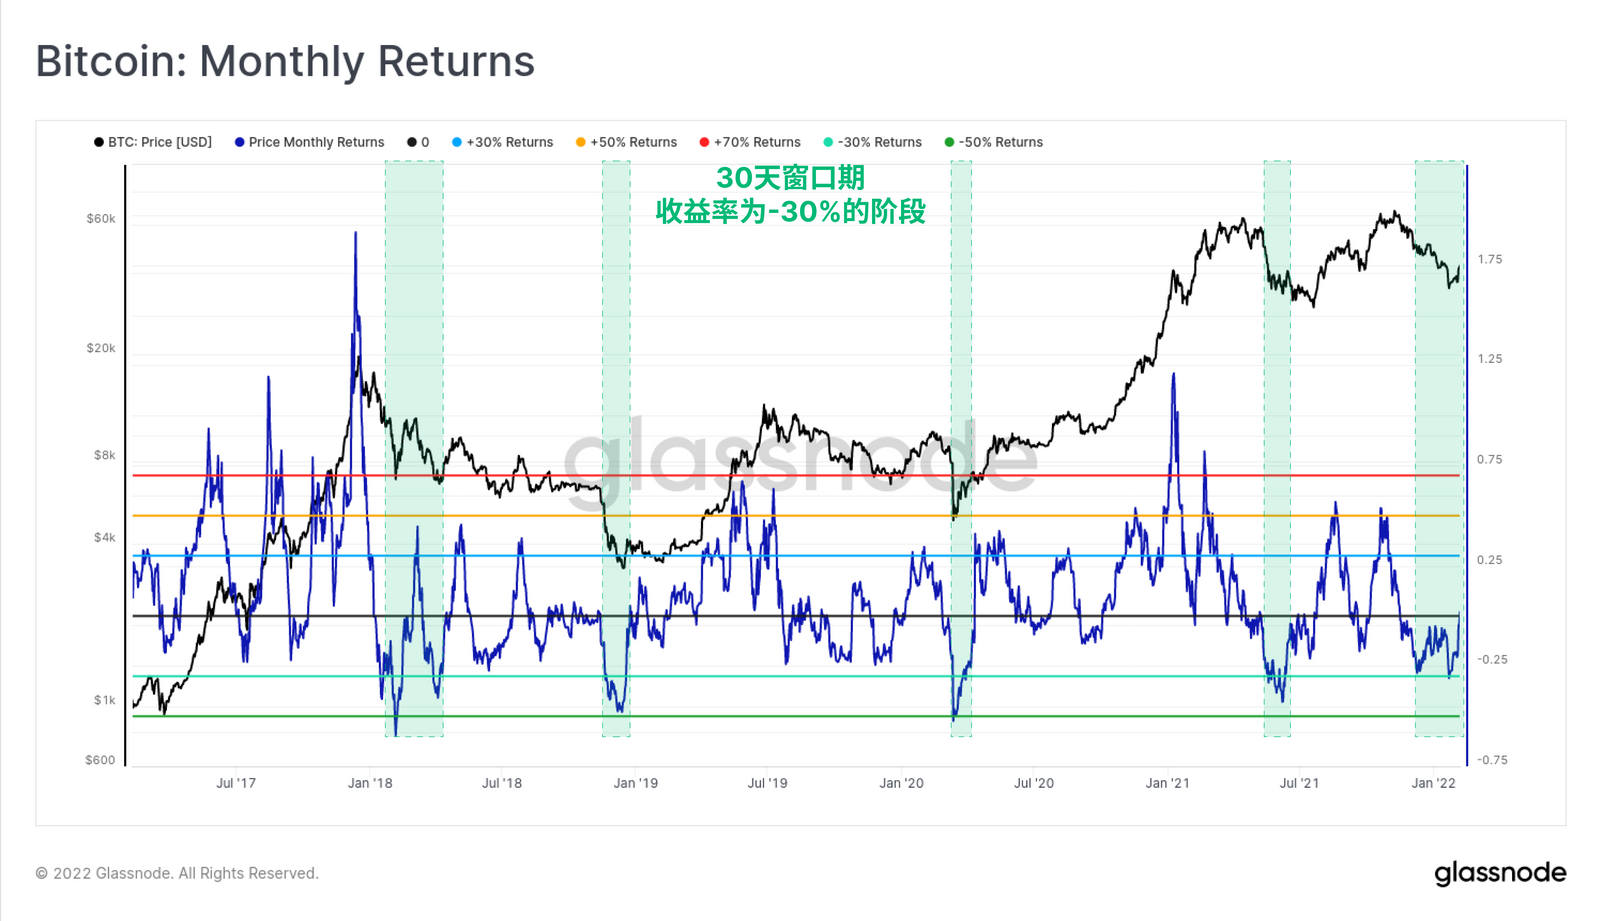
The uptrend comes on the heels of a fairly sustained three-month downtrend that has pushed bitcoin's monthly return curve into negative territory. The chart below shows the 30-day bitcoin return (%), historically a negative return of -30% is a sign of oversold conditions. Only five times in the past five years have monthly returns been so dismal.
· January-April 2018 correction, starting bear market.
· Bear market capitulation in November 2018.
· March 2020, COVID-19, global economic lockdown, widespread market sell-off.
· The sell-off and deleveraging event in May 2021.
· Dismal year-to-date performance in 2022.
An estimate of the fair value of bitcoin
Over the years, many methods and models have been created to value bitcoin, and any method or model should be a collection of many metrics and indices.
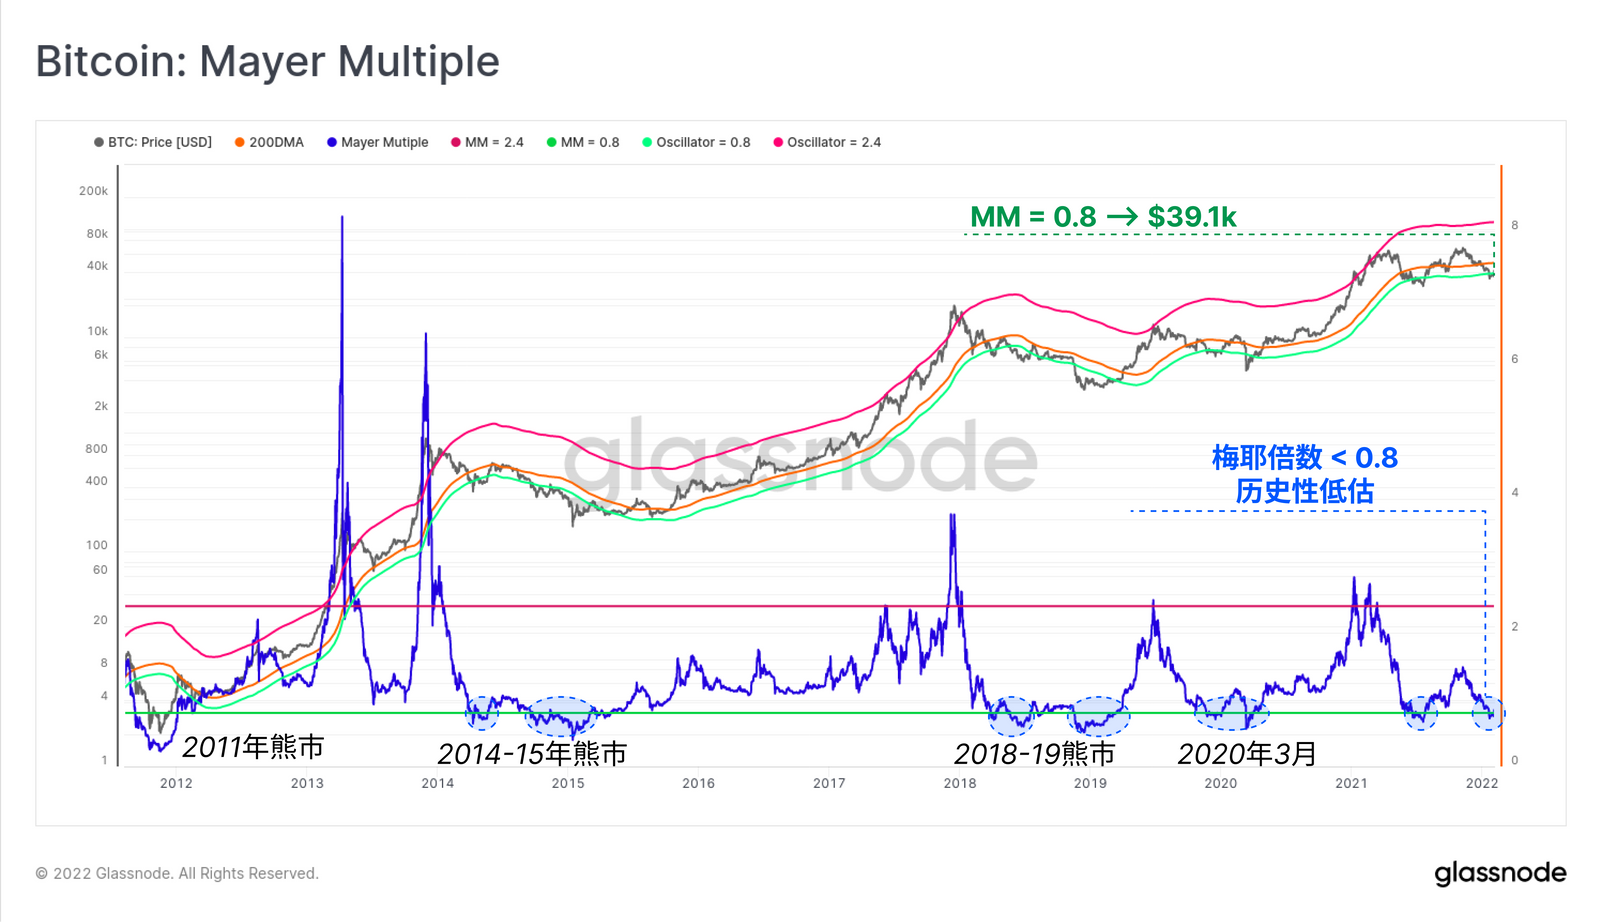
One of the simplest, but still very powerful, tools is the Meyer multiple, which is the ratio between the price and the 200-day moving average. In technical analysis, traders commonly use the 200-day moving average as a long-term bull/bear indicator, so a steep deviation below this indicator can indicate the extent of undervaluation relative to the long-term average. This week the Meyer multiple is below 0.8, representing a discount of more than 20% to the 200-day moving average. A Meyer multiple of 0.8 corresponds to a price of $39,100, now the market has recovered (calculated as 0.8 x 200-day moving average).
Similar to the monthly return indicator, previous episodes of meyer multiples below 0.8 have generally been associated with severe declines in bear markets, particularly during market-wide capitulation events (e.g., January 2015, November 2018, and March 2020).
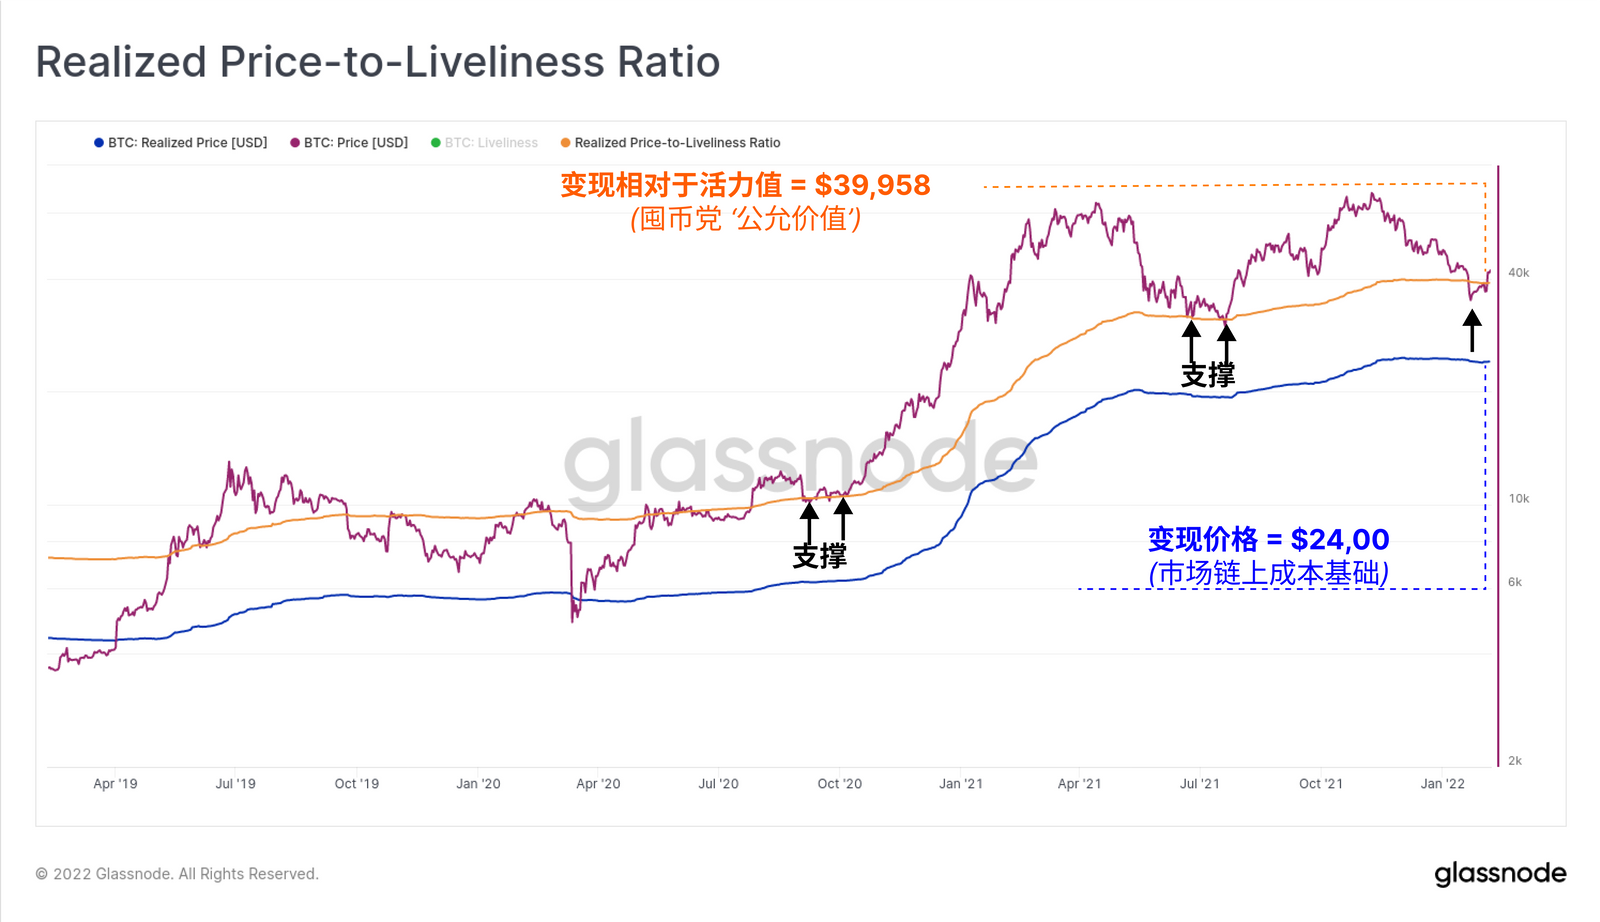
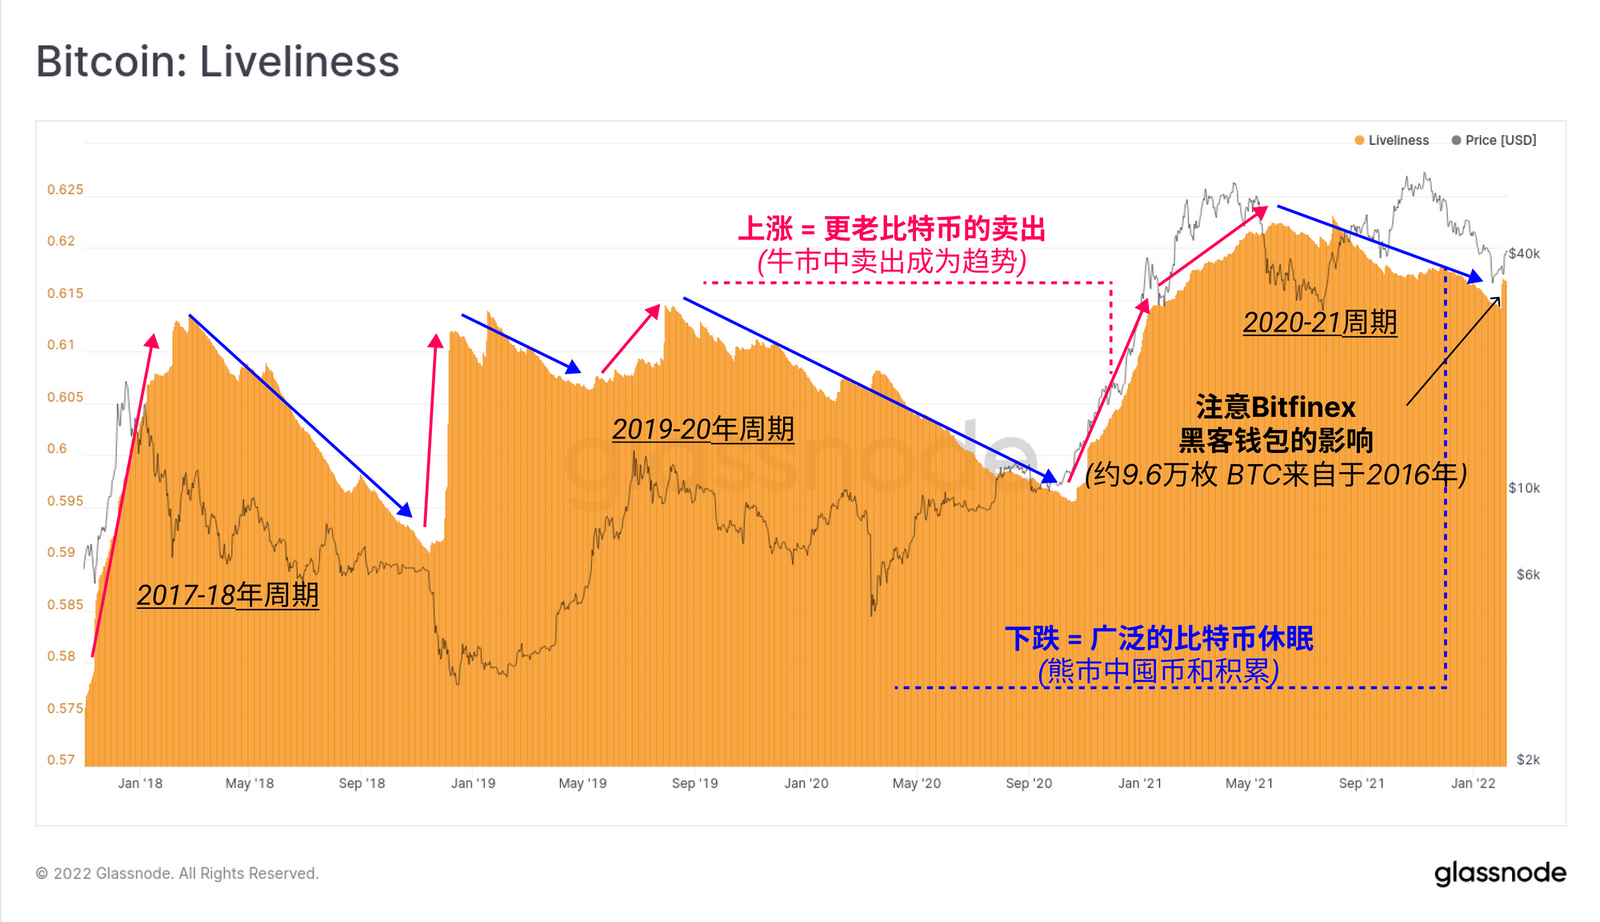
Another measure of "fair value" is the realisation to vitality ratio (RTLR), which has been proposed to estimate the "fair value" of bitcoin priced by the hoarder community. During bitcoin's severe dormancy, vitality declines, so when vitality is placed in the denominator, the realized price is magnified (and vice versa).
This indicator provided support ahead of the major bull impulse in late 2020 and again in June and July 2021. The market traded below this level last week, but has since recovered the RTLR level at $39,958, which is reasonably consistent with support at 0.8.
About the 2016 Bitfinex hacker wallet
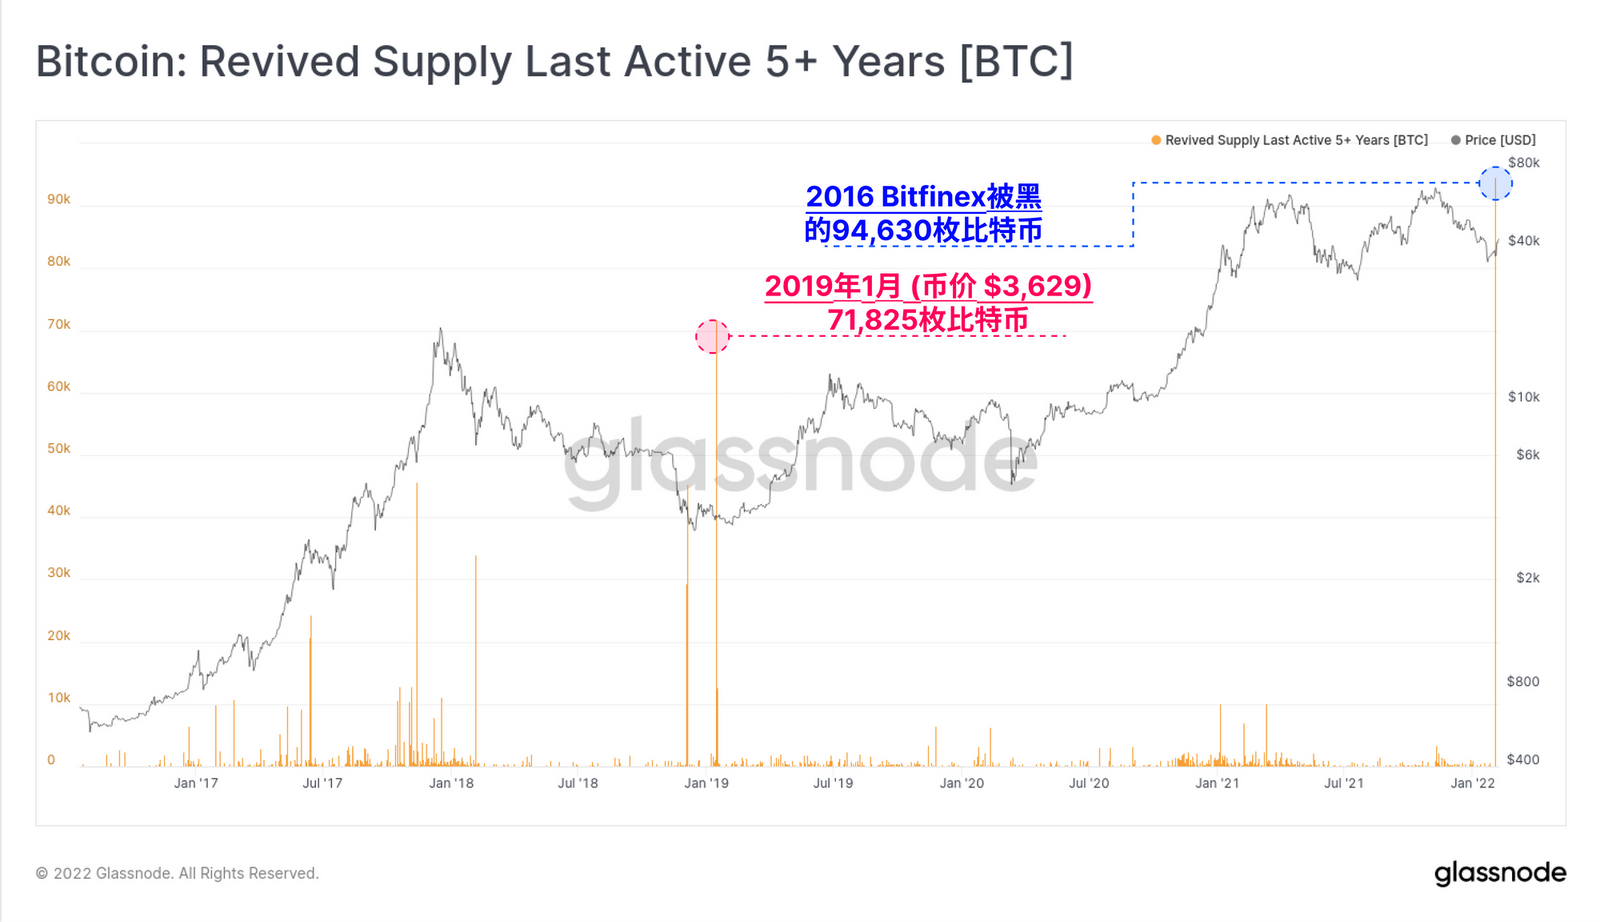
This week, some on-chain indicators were detected with2016 Bitfinex hackersWallet related to the very large sale of 94,643 bitcoin, its market capitalization of $3.67 billion. Given the large scale in terms of coin volume, dollar value, profits realized, and longevity of disruption, this makes an interesting case for evaluating how abnormal events on the chain affect indicator interpretation.
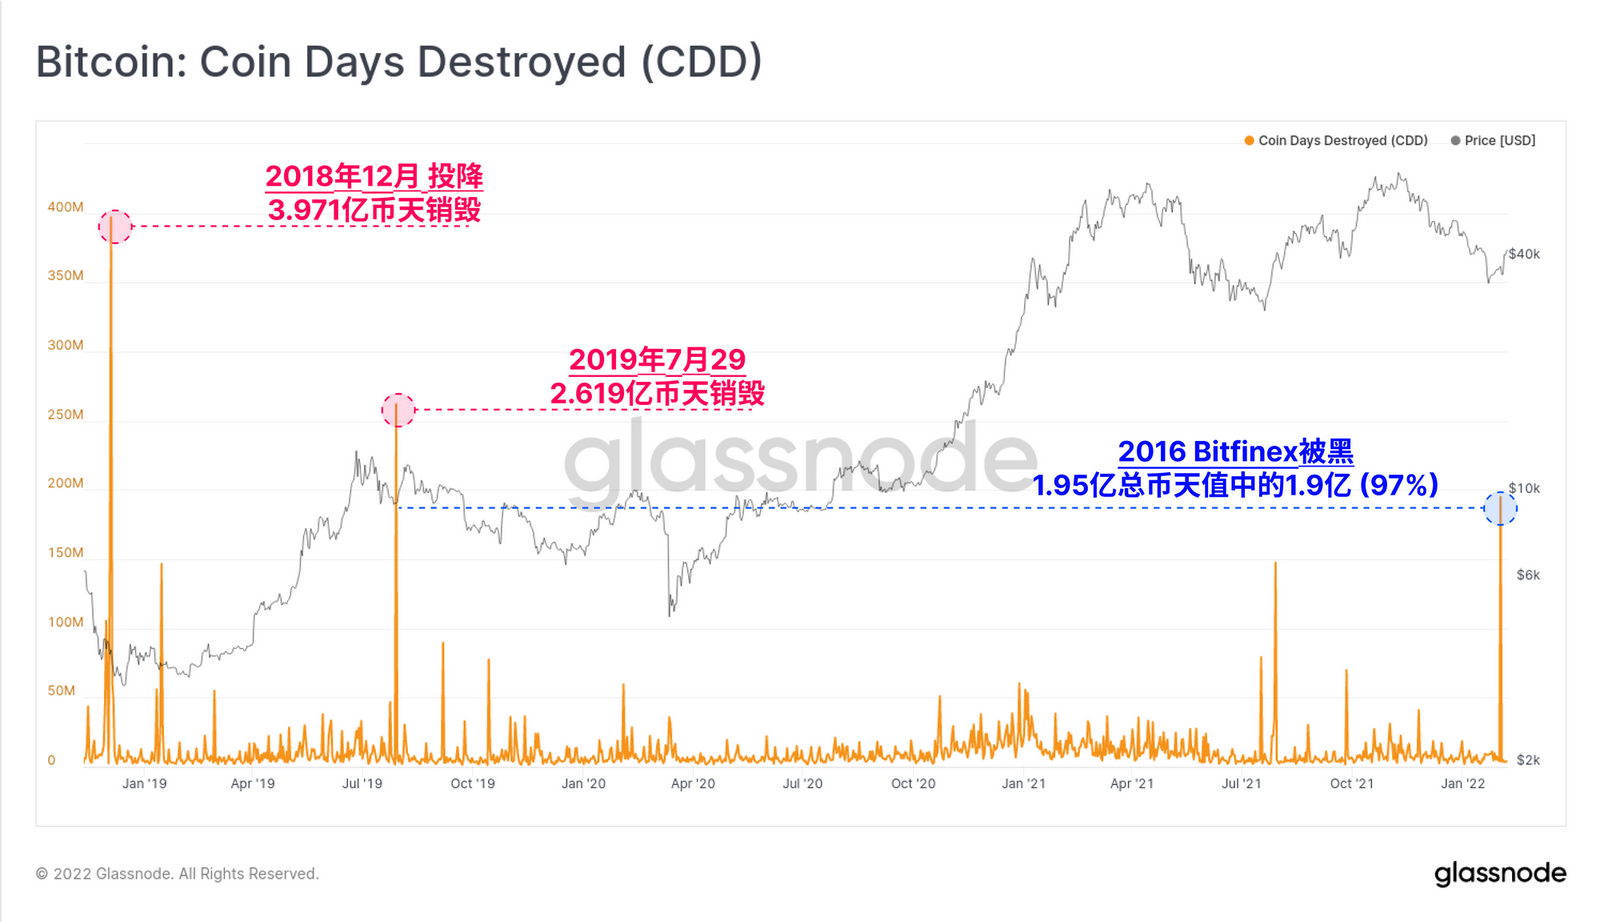
As you can see, this is the largest sale of coins over five years old in the history of the recovery supply, surpassing the 71,825 coins sold in January 2019, when the price was $3,629.
The number of bitcoin days destroyed also soared to a multi-year high, with 195 million days destroyed, of which 190 million (97 percent) were related to Bitfinex wallets.
As noted above, a declining vitality indicator suggests that there are more bitcoins in the entire bitcoin supply that are dormant and accumulating life (coin days), compared to those that are being sold and ruining coin days. This is a classic hoarding period, usually synonymous with a bear market.
Activity is in the established downtrend, with the notable exception of this week's vertical increase due to Bitfinex selling, which lifted the macro gauge 0.38% on the day.
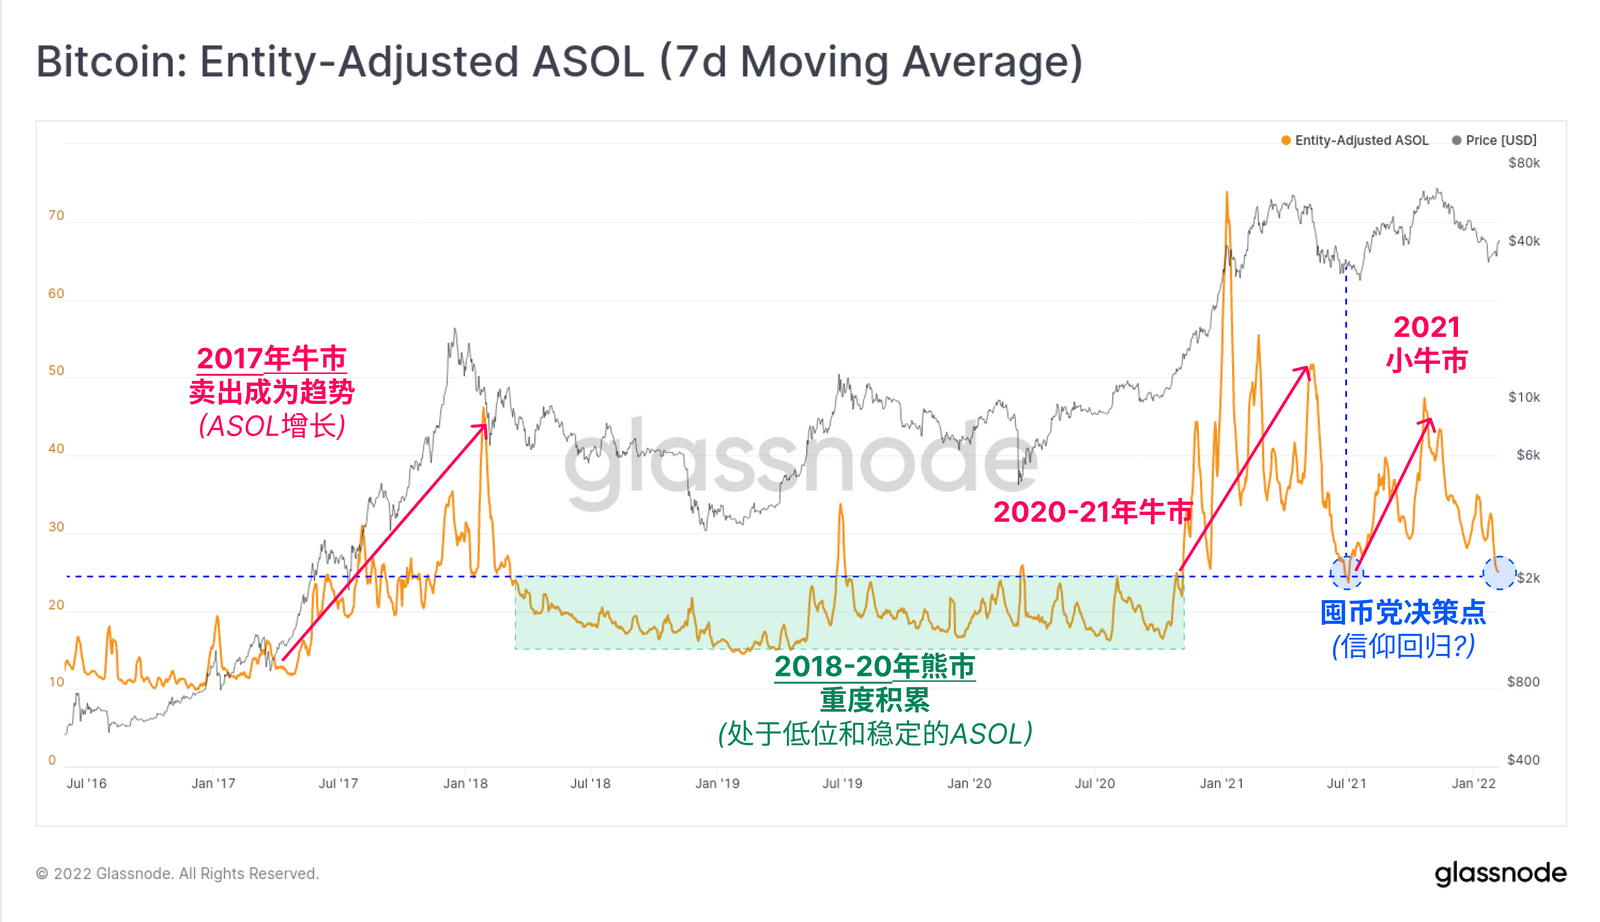
There is a coin age indicator that can be used to eliminate anomalies like this, that is, the few wallets that sell very heavily/old coins, and that indicator is ASOL. The average spent output life metric measures the average life of bitcoins sold on a per UTXO basis, completely ignoring the number of bitcoins (as measured by coin day destruction and sleep, for example).
ASOL has not responded meaningfully to the Bitfinex wallet, and in fact the value has fallen to the low of the last visit in June 2021. The uptrend of ASOL is typical, and broad selling of old coins usually occurs in bull markets. By contrast, a downward trend like the one now suggests hoarding is the preferred behavior, consistent with a macro-scale decline in activity.
Abstract
As bitcoin prices rebound from multi-month lows, we investigate the underlying drivers and assess investor support in the $30,000 - $40,000 range. The market low of $33,500 set last week was associated with historical undervaluation of a range of metrics, including meyer multiples, RTLR and monthly return profiles.
The supply distribution of the market remains top-heavy, with 25% of bitcoins in unrealized losses. However, there is a reasonable degree of momentum behind this rebound as STHs returns to profitability and the short-term MRG oscillator reverses into positive territory. Looking ahead, the key is whether long-term holders and old coins exit liquidity, and whether the rally can be supported by new demand, which has generally been lacking since the May sell-off.
The original link
Welcome to join the official BlockBeats community:
Telegram Subscription Group: https://t.me/theblockbeats
Telegram Discussion Group: https://t.me/BlockBeats_App
Official Twitter Account: https://twitter.com/BlockBeatsAsia