Forum
Forum OPRR
OPRR Finance
 Specials
 On-chain Eco
 Entry
Entry
 Podcasts
 Data
Data

LD Capital: Opportunity or trap to buy ETH with 50% discount? In-depth analysis of Grayscale trust (2)

 Summarized by AI
Original title: ""Trend Research by LD Capital" Grayscale Trust In-depth Interpretation | Why can I buy Ethereum at half price? (2)"
Original source: LD Capital
Introduction
Grayscale Ethereum Trust (ETHE), as the largest Ethereum product listed on the US stock market, has a position of 3 million ten thousand ETH. However, its current secondary market transaction price compares with the net value (NAV) of nearly 50% About the price discount, we analyzed the reasons for the discount and premium of this product in the previous report , and several situations where the discount may narrow, and based on the law of cycle rotation, we believe that if you bet on a potential bull market, ETHE has better flexibility than ETH spot. However, we also found that historical data calculations show that the risk-return value of ETHE is not good, and its performance in risk-adjusted return, maximum drawdown, volatility, etc. is worse than that of ETH/USD. It means that if you plan to hold ETHE for a long time, you may need to do some targeted income enhancement strategies, otherwise if the bull market cannot come quickly, its performance may be weaker than the market.
As the second report in the series, we will discuss how to build an index enhancement strategy for ETHE, obtain the long-term Beta return value of assets, and conduct appropriate active management to obtain Alpha returns, improving investors' experience in holding assets for a long time.
Grayscale ETHE Risk and Return Overview of Grayscale ETHE
First Analyze the characteristics of the core target of this strategy, Grayscale ETHE :

The above table makes statistics on the price performance of ETHE and ETH-USD in the range of 01/01/2020 – 04/30/2023 The performance of risk indicators such as retracement, risk value, and risk-adjusted income is worse than that of ETH spot, but its income presents a right-biased fat-tailed distribution, which means that positive fluctuations have more potential:
Revenue Performance:Grayscale ETHE 's arithmetic average monthly rate of return is 8.91% , and the annualized rate of return is 178.48% ; while the arithmetic average monthly rate of return of Ethereum spot is 10.60% , and the annualized rate of return is 235.03% . From this indicator, the return performance of Ethereum spot is better than Grayscale ETHE. In terms of geometric average rate of return, the annualized rate of return of Grayscale ETHE is 40.03% , while the annualized rate of return of Ethereum spot is 120.08% , indicating that the long-term investment performance of Ethereum spot is better.
Risk performance:Grayscale ETHE 's monthly and annualized standard deviations are 38.16% and 132.18% respectively , which is higher than the 29.01% and 100.48% of Ethereum spot, indicating that the price of Grayscale ETHE fluctuates greatly and the risk is relatively high. In addition, the largest drawdown of Grayscale ETHE is -89.60% , which is also higher than -77.96% of Ethereum spot, which further shows that the risk of Grayscale ETHE is higher.
Risk-adjusted return:Sharpe Ratio and Sortino Ratio are used to evaluate the risk of investment Index of adjusted earnings. It can be seen from the table that the Sharpe ratio of Grayscale ETHE is 0.8 , while the Sharpe ratio of Ethereum spot is 1.25 ; the Sortino ratio of Grayscale ETHE is 1.72 The Sortino Ratio of Fang Spot is 2.69 . This shows that Ethereum spot outperforms Grayscale ETHE when risk is taken into account.
Market Correlation: The Beta coefficient (Beta) in the table shows that the Beta coefficient of Grayscale ETHE is 0.9 , which means that the systemic risk (ETH) of Grayscale ETHE is relatively high. However, the Alpha coefficient (Alpha) shows that Grayscale ETHE 's annualized Alpha is -8.14% , indicating that after excluding market risks, Grayscale ETHE failed to achieve positive returns within the statistical range.
Profit-loss ratio:Grayscale ETHE 's profit-loss ratio is 1.46 , which is slightly lower than that of Ethereum spot 1.48 This means that the performance of the two in terms of profit and loss is not much different.
Profit and loss cycle: From the perspective of positive profit cycle, Grayscale ETHE has 23 out of 41 cycles positive return cycles, accounting for 56.10% , while Ethereum spot has 26 positive return cycles in 41 cycles, accounting for 63.41% . This shows that Ethereum spot has more profit cycles.
Value-at-Risk (VaR):Grayscale ETHE History VaR (5% ) is -38.01% , analysis VaR (5% ) is -53.85% , and the historical VaR (5% ) of Ethereum spot is -30.15% , analysis VaR (5% ) is -37.11% . This shows that the potential maximum loss of Grayscale ETHE is greater than that of Ethereum spot under the same confidence level.
Conditional Value-at-Risk (CVaR):Grayscale ETHE CVaR (5% ) is -44.36% , while the CVaR (5% ) of Ethereum spot is -43.67% . This means that in a worst-case scenario, Grayscale ETHE's losses could be similar to those of Ethereum spot.
Upside Capture Ratio and Downside Capture Ratio: The upside capture ratio of Grayscale ETHE is 86.74% , and the downside capture ratio is 117.95% , which shows that Grayscale ETHE captures less upside gains when the market is up, and a higher degree of losses when the market is down.
Revenue distribution pattern:Grayscale ETHE 's Excess Kurtosis is 0.46 , Skewness is 0.84 ; ETH 's Excess Kurtosis is -0.37 , and Skewness is 0.27 . This shows that the Grayscale ETHE return distribution presents a steeper peak shape than the normal distribution, indicating that its extreme return (positive or negative) has a higher probability of occurrence. At the same time, its skewness is positive, indicating that the return distribution is skewed to the right, and the extreme value of the positive return is larger. This may mean that Grayscale ETHE is a riskier investment, but may have higher earning potential in terms of positive volatility.
Why is the performance of ETHE , which is also based on ETH spot as the underlying asset, lagging behind?
This is mainly due to its special products, market structure and changes in the market environment, which led to a premium in its early comparison with NAV (2019 – 2021 ; mid-year) in the latter part of the year (2021 to now), the sharp drop in prices from premium to discount of nearly 90% has dragged down the overall risk-return indicator.
The reason behind the negative premium/positive premium is that Grayscale ETHE Trust cannot directly redeem the fund product structure. The reasons for the positive premium include that the product is accessible The accessibility is higher than ETH spot, and compared with the cost of keeping private keys by yourself ETHE is more suitable for traditional financial institutions and small white retail investment; balance sheet entry processing, tax advantages and help investors bypass compliance Related issues: The reasons for the negative premium include the fund structure that cannot directly apply for redemption, the limitation of arbitrage opportunities, the discount of opportunity cost, and the impact of competitive products.
For more analysis, please refer to the series of reports "LD Capital: In-depth analysis of Grayscale trust, 50% off to buy ETH opportunity or trap? "
Principles of Index Enhancement Fund Strategy
An index enhancement strategy is a portfolio management approach that attempts to amplify the return of an underlying portfolio or index , and surpass the index in terms of yield or risk indicators.
This strategy needs to use ETHE as the cornerstone position, allocate no less than 60% of funds in ETHE spot, and allocate the remaining funds In cash, fixed-income products, U.S. stock blockchain and cryptocurrency-related conceptual stocks, and option derivatives for these stocks.
Index enhancement combines elements of active and passive management. Due to the factors of active management, investment introduces the risk of subjective judgment of strategic managers. In contrast, passive index funds only need to worry about market risks.
The core source of excess income for establishing a portfolio based on ETHE is to bet on the narrowing of ETHE 's secondary market price and NAV , but in view of ETHE's historical return statistics are poor. In order to improve the holding experience during the holding process, we need:
Diversified configuration. Add some assets with not particularly high correlation, stable income, and low volatility to the investment portfolio, and correct the poor risk-reward ratio, such as cash, fixed income products, US stock blockchain and cryptocurrency related Concept stocks, and option derivatives of these stocks.
High position. From the previous data, it can be seen that ETHE may have higher income potential in terms of positive fluctuations. Therefore, in order to avoid missing the extreme rising market, ETHE’s overall position needs to be maintained at a high level. Square trust crisis, Grayscale major financial crisis), should not be lower than the configuration of 80% .
Derivatives enhanced. In the part of stock selection enhancement, using option strategy at the same time has more advantages than simply holding the target. The source of excess returns is mainly to obtain the volatility premium of option pricing, supplemented by the construction of complex option strategies to form a more targeted investment strategy.
Margin financing. The index enhancement effect that margin financing and securities lending can bring generally comes from two aspects: when you are optimistic about the market outlook, you can use your own stocks or ETFs as margin financing to increase leverage; income. If ETHE supports margin financing and securities lending or stock selection in the future, this is also one of the alternative strategies
Innovation. With the improvement of the regulatory environment, more and more traditional brokerages have entered into the encrypted asset trading business. In the future, it is not ruled out that the initial public offering of encrypted assets on the regulated brokerage platform is historically seen in the so-called ICO, IDO The return is very impressive, and we can also use our positions as new positions with a small amount of cash to participate.
Specific methods
Because 4, 5 are temporarily difficult to carry out, so Looking at the operations of 1 ~ 3 , we need:
Select Index
ETHE single asset is used as the main tracking index, supplemented by ETH/USD as the reference index. Since the single asset is not the enhancement of the traditional broad-based index, in the face of the "narrow-based" index with a high degree of risk concentration, controlling volatility and controlling retracement are the goals that require more efforts when active management provides additional value.
Fund allocation
For portfolio performance that does not deviate significantly The benchmark index needs to maintain at least 60% of the capital ratio on ETHE. Under normal circumstances, the weight of 80 – 90% should be maintained, and the capital weight inflation of income enhancement is 10 ~ ;20% weighting.
Stock Picking Enhanced
Due to ETHE Shares It is currently traded in the OTCQX market, which is the so-called over-the-counter securities market (OTC). The securities here are usually traded with limited activity and there is no standard option market, so it is impossible to use the balance of the brokerage platform as collateral for covered options Selling strategy, or margin trading operation. Then the primary focus of the enhancement is to optimize the allocation of concept stocks related to blockchain and cryptocurrency.
Table 1 : Main blockchain or cryptocurrency concept stocks listed in the US and Canada

Table 2 : Main blockchain or cryptocurrency concept ETFs listed in the US and Canada

The criteria for investment target selection are:
Companies with a clear business plan for the crypto ecosystem or indirectly benefiting from the development of the cryptocurrency industry, including crypto mining companies, mining equipment/chip suppliers, crypto Financial service companies or other financial institutions, metaverse business companies, etc. that mainly provide services for encryption-related customers;
Or the main investment strategy is to focus on digital currency spot or Fund products of its derivatives;
Or invest in the fund product shares of the above two.
Why crypto stocks:
Based on Encrypted stocks have a moderate correlation with encrypted assets, and establish exposure to encrypted markets in a safe, convenient, and compliant manner.
Correlations between crypto stocks and crypto assets typically range between moderate ( 0.40) and significant ( 0.90). Additionally, many crypto companies and cryptocurrencies have historically had beta values greater than 1 . This amplified exposure can make crypto stocks an effective vehicle for gaining exposure to price volatility in the crypto market. In addition, not only ETHE, some encryption funds (such as BITW) have a market value lower than NAV due to similar structural problems, and they can also bet on the return of the discount.
Table: Monthly Return Correlations of Major Crypto Stocks and ETH, ETHE (5/01/2021 – 05/04/2023 ):

Note: The statistical period is subject to COIN Stock 2021 May will be listed for trading; CASH represents cash
Derivatives Enhanced
< br>
Option enhancement is mainly based on the stocks/ETF spot positions you own to carry out the covered opening strategy, that is, to sell the same number of shares with a certain amount of out-of-value Call, which can be used when the market falls Or obtain excess returns relative to the spot when it rises steadily.
At the same time, after judging from the macro, technical and industry fundamental factors, the cover strategy can be adjusted. For example, use ratio call spread. Do calendar spread when the deadline structure is appropriate.
When it is necessary to protect the portfolio , the option structure can be formulated according to the level of the implied volatility. For example, when implied volatility is high and wings is relatively high compared to atm , you can choose the structure of put spread collar
Example of option enhancement strategy


Subjective timing
Analysis of macroscopic + technical + industry fundamentals and timing of some spot positions is also a source of excess returns, but overall as an ETHE enhancement strategy, position timing should be downplayed.
< br>
Specifically:
Macro timing: comprehensively judge the numbers through analysis at the macro, policy, and economic cycle levels The overall future trend of the currency market.
Industry timing: enterprise/project research, event-driven, multi-factor stock selection, etc.
Technical Timing: Use graphical technical analysis to study and judge the continuity of the trend, and make appropriate adjustments before and after the key resistance and support levels.

The purpose of the above strategies is mainly for:
Long-term Holding the core assets of the encrypted market - ETH is the core infrastructure of mainstream Web 3 applications. In addition to being able to undertake the liquidity spillover and configuration diversification needs of legal currency wealth like BTC , it will also have additional Web 3 Brought by the ecological application;
Misalignment does not affect the cornerstone position-doing timing operations does not affect the high position of ETHE, so as to avoid missing the abnormal rise in the tail;< /p>
Focus on the alpha of the stock - selecting more excellent companies will obtain excess returns higher than the market average return in the long run.
Acquiring Volatility Returns——Transforming black swan risk and long-short conversion volatility into long-term index long-term "alpha" through options
Empirical Study
Next, based on historical data, we will analyze the proposed method based on Grayscale ETHE 's index enhanced fund strategy conducts empirical analysis to evaluate the effectiveness and feasibility of the strategy.
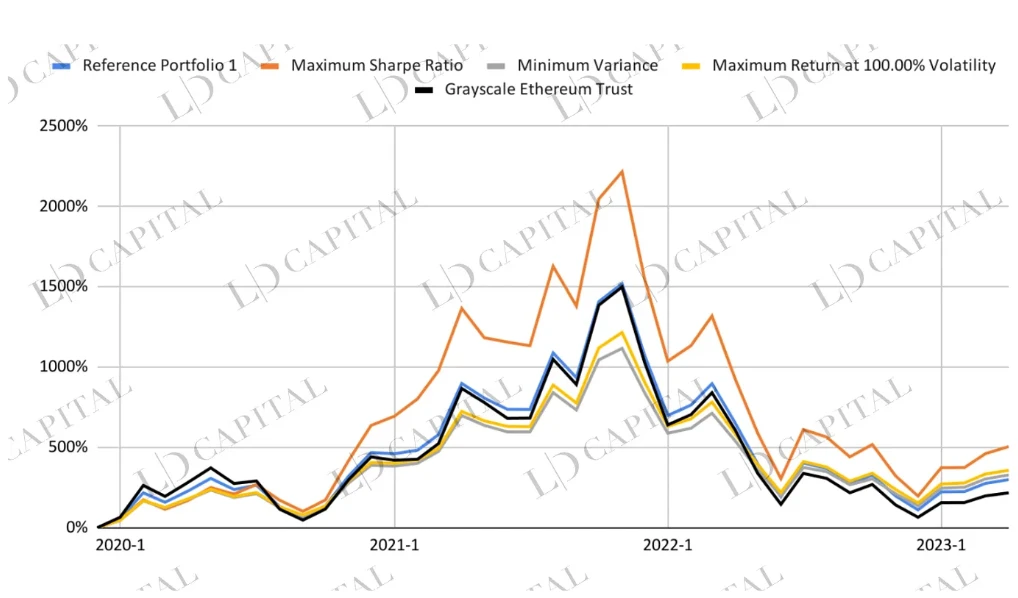
Based on the historical market conditions of 2020 January~ 2023 2023 2023 4 OPRE is used to simulate partial returns of options) for monthly return statistics, and then conditional constraints on the highest and lowest ratios of each asset allocation, and based on three methods to obtain the optimal combination configuration respectively:
Maximum Sharpe Ratio Optimization - Finding the Optimal Risk-Adjusted Portfolio on the Efficiency Boundary Based on Mean Variance
Minimum Variance ——In a group of assets, its portfolio risk (measured by variance or standard deviation) is the smallest
Maximum under a given annual volatility target 100% Maximize Returns – seek to maximize the expected return of a portfolio for a given level of risk

< /p>


The performance of each combination is as follows, in which the ETHE performance of the black line and the unoptimized reference combination 1 blue line can be used as a reference comparison :
< img alt="LD Capital: An in-depth analysis of Grayscale Trust, an opportunity or a trap to buy ETH at a 50% discount? (2)" src="https://piccdn.0daily.com/202305/07100603/r7iz7oa5u6n7j92x.png!webp" \="">
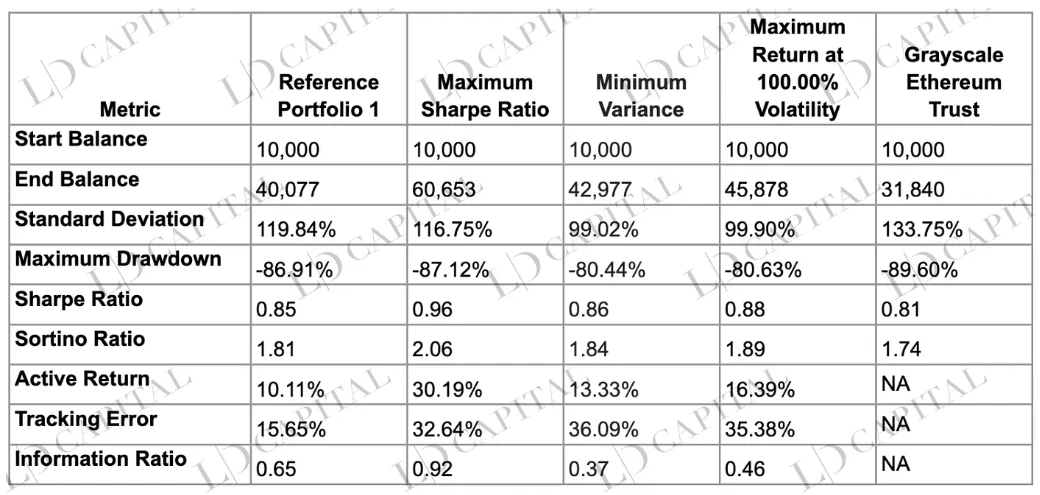
The table shows four optimized investment portfolios, including the maximum Sharpe ratio, minimum variance, and the performance comparison of the maximum return portfolio under 100% volatility and the single asset Grayscale Ethereum Trust (as a benchmark), which can be It can be seen that the optimized portfolio beats simply holding ETHE in almost all risk-return indicators, and the maximum Sharpe ratio portfolio is superior to other portfolios in terms of income, risk control, and risk-adjusted income:
< /p>
You can observe these data from the following aspects:
Revenue:
Revenue:In a given period, the final balance of the largest Sharpe ratio portfolio is 60, 653 , which is the best performer, significantly outperforming other portfolios and benchmark assets. The smallest variance portfolio and volatility at 100% The terminal values of the maximum return portfolios under the ratio are 42, 977 and 45, 878 , which are also higher than the 31, 840 of the benchmark assets. This shows that the optimized investment The combination is better than a single asset in terms of return.
Risk: From the perspective of standard deviation, the risk level of the minimum variance combination is the lowest ( 99.02% ), while the benchmark asset had the highest level of risk (133.75% ). In terms of maximum drawdown, the minimum variance portfolio and the maximum return portfolio at 100% volatility had lower maximum drawdowns (-80.44% and -80.63% respectively), while the benchmark asset had the highest maximum drawdown (-89.60% ). This indicates that the optimized portfolio also performed better in terms of risk control.< /p>
Risk-Adjusted Return: The Sharpe and Sortino ratios measure expected return per unit of risk and expected return per unit of downside risk, respectively. Expected return. The portfolio with the largest Sharpe ratio performed best on both metrics ( 0.96 for Sharpe and 2.06 for Sortino), meaning that the risk-adjusted return This portfolio outperforms other portfolios and benchmark assets in terms of .
Relative return and risk:Active return, tracking error and information ratio Measured the excess return, risk and risk-adjusted excess return of the optimized portfolio relative to the benchmark asset. From these three indicators, the maximum Sharpe ratio portfolio performed the best: the active return was 30.19% , and the information ratio was 0.92 (The ratio of active return to tracking error).This shows that the maximum Sharpe ratio portfolio also has an advantage in terms of performance relative to the benchmark asset, and the portfolio can achieve some excess return under the condition of taking moderate risk .
Note: Optimization is based on monthly return statistics for selected portfolio assets over a given time period. Optimization results do not predict that allocations will perform best outside of a given time period, and the actual performance of a portfolio constructed using optimized asset weights may differ from a given performance target.
Conclusion
In summary, ETHE itself has a poor risk-return It can be enhanced by different configuration methods, and the simulated portfolio is better than the benchmark asset ETHE in terms of return, risk control and risk-adjusted return. Investors can choose an investment method that suits them according to their own risk preference and investment goals, so as to improve the holding experience and strike a balance between maximizing returns and minimizing risks.
Original link
Welcome to join the official BlockBeats community:
Telegram Subscription Group: https://t.me/theblockbeats
Telegram Discussion Group: https://t.me/BlockBeats_App
Official Twitter Account: https://twitter.com/BlockBeatsAsia