Forum
Forum OPRR
OPRR Finance
 Specials
 On-chain Eco
 Entry
Entry
 Podcasts
 Data
Data

Glassnode: Cryptocurrency market volatility may increase in the short term, approaching the turbulent 2019

 Summarized by AI
Original Title: Short-Term Holder Stress
Original Author: UkuriaOC, CryptoVizArt, Glassnode
Original Translator: Wuzhu, Golden Finance
Summary:
· On average, BTC investors’ unrealized losses are relatively small compared to previous cycles, indicating that the overall situation is relatively favorable.
· However, the unrealized losses of short-term holders are still quite high, indicating that they are the main risk group.
· Profit and loss activities are still very rare, and key indicators such as the sell-side risk ratio suggest that volatility may increase in the near term.
Market Downside
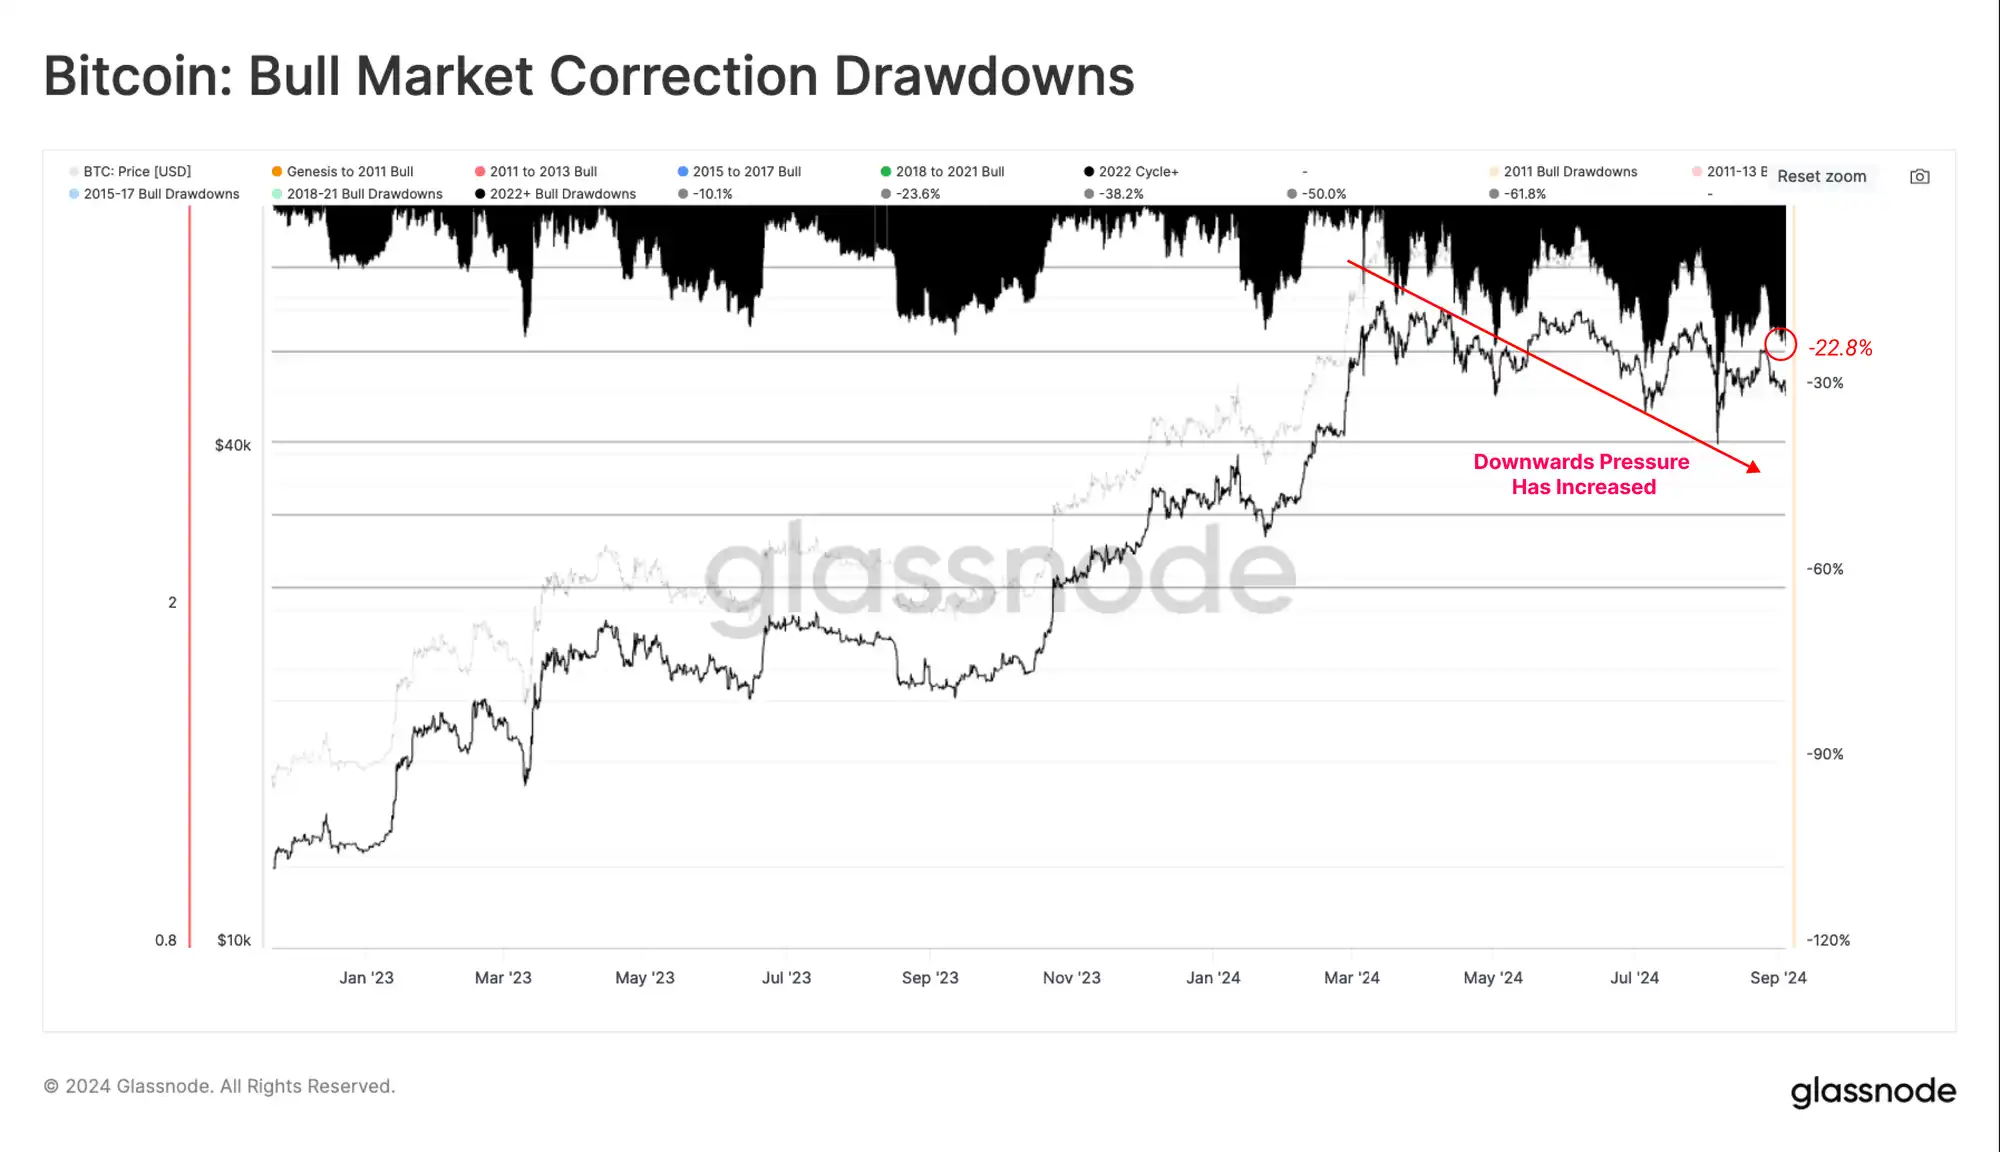
Price movements have stagnated over the past six months, and investor sentiment has been low. However, the past three months have seen a marked shift, with downward pressure increasing, causing the market to experience its worst decline of this cycle.
However, from a macro perspective, spot prices are currently around 22% below their all-time highs, a relatively small decline compared to historical bull runs.
Current Market Pressure
As downward price pressure increases, it is wise to assess the unrealized losses held by investors to assess the financial pressure they are experiencing.
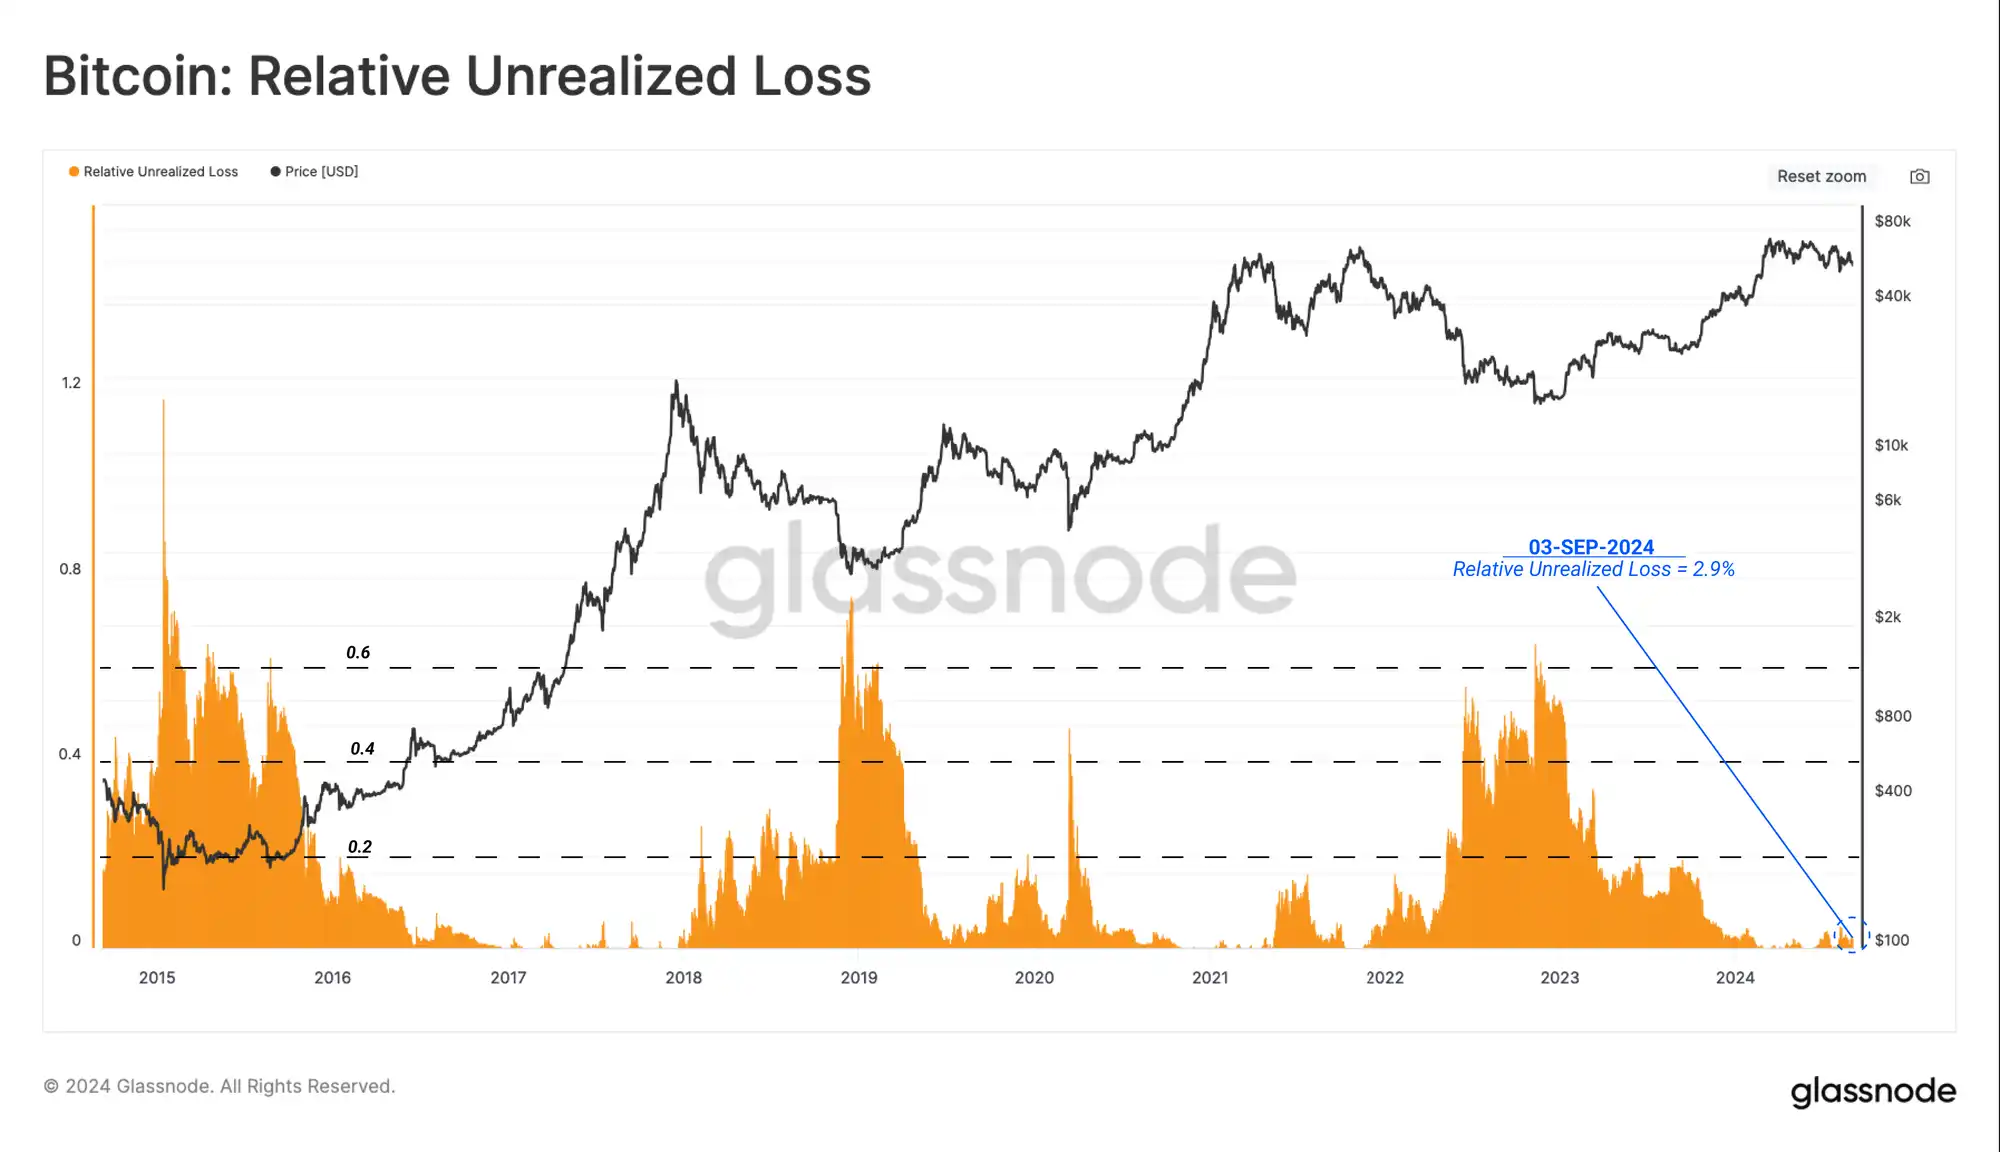
From a broader market perspective, unrealized losses remain at historical lows. Total unrealized losses represent just 2.9% of Bitcoin’s market cap, which is at a historical low.
This suggests that investors overall remain relatively profitable even amid ongoing price declines.
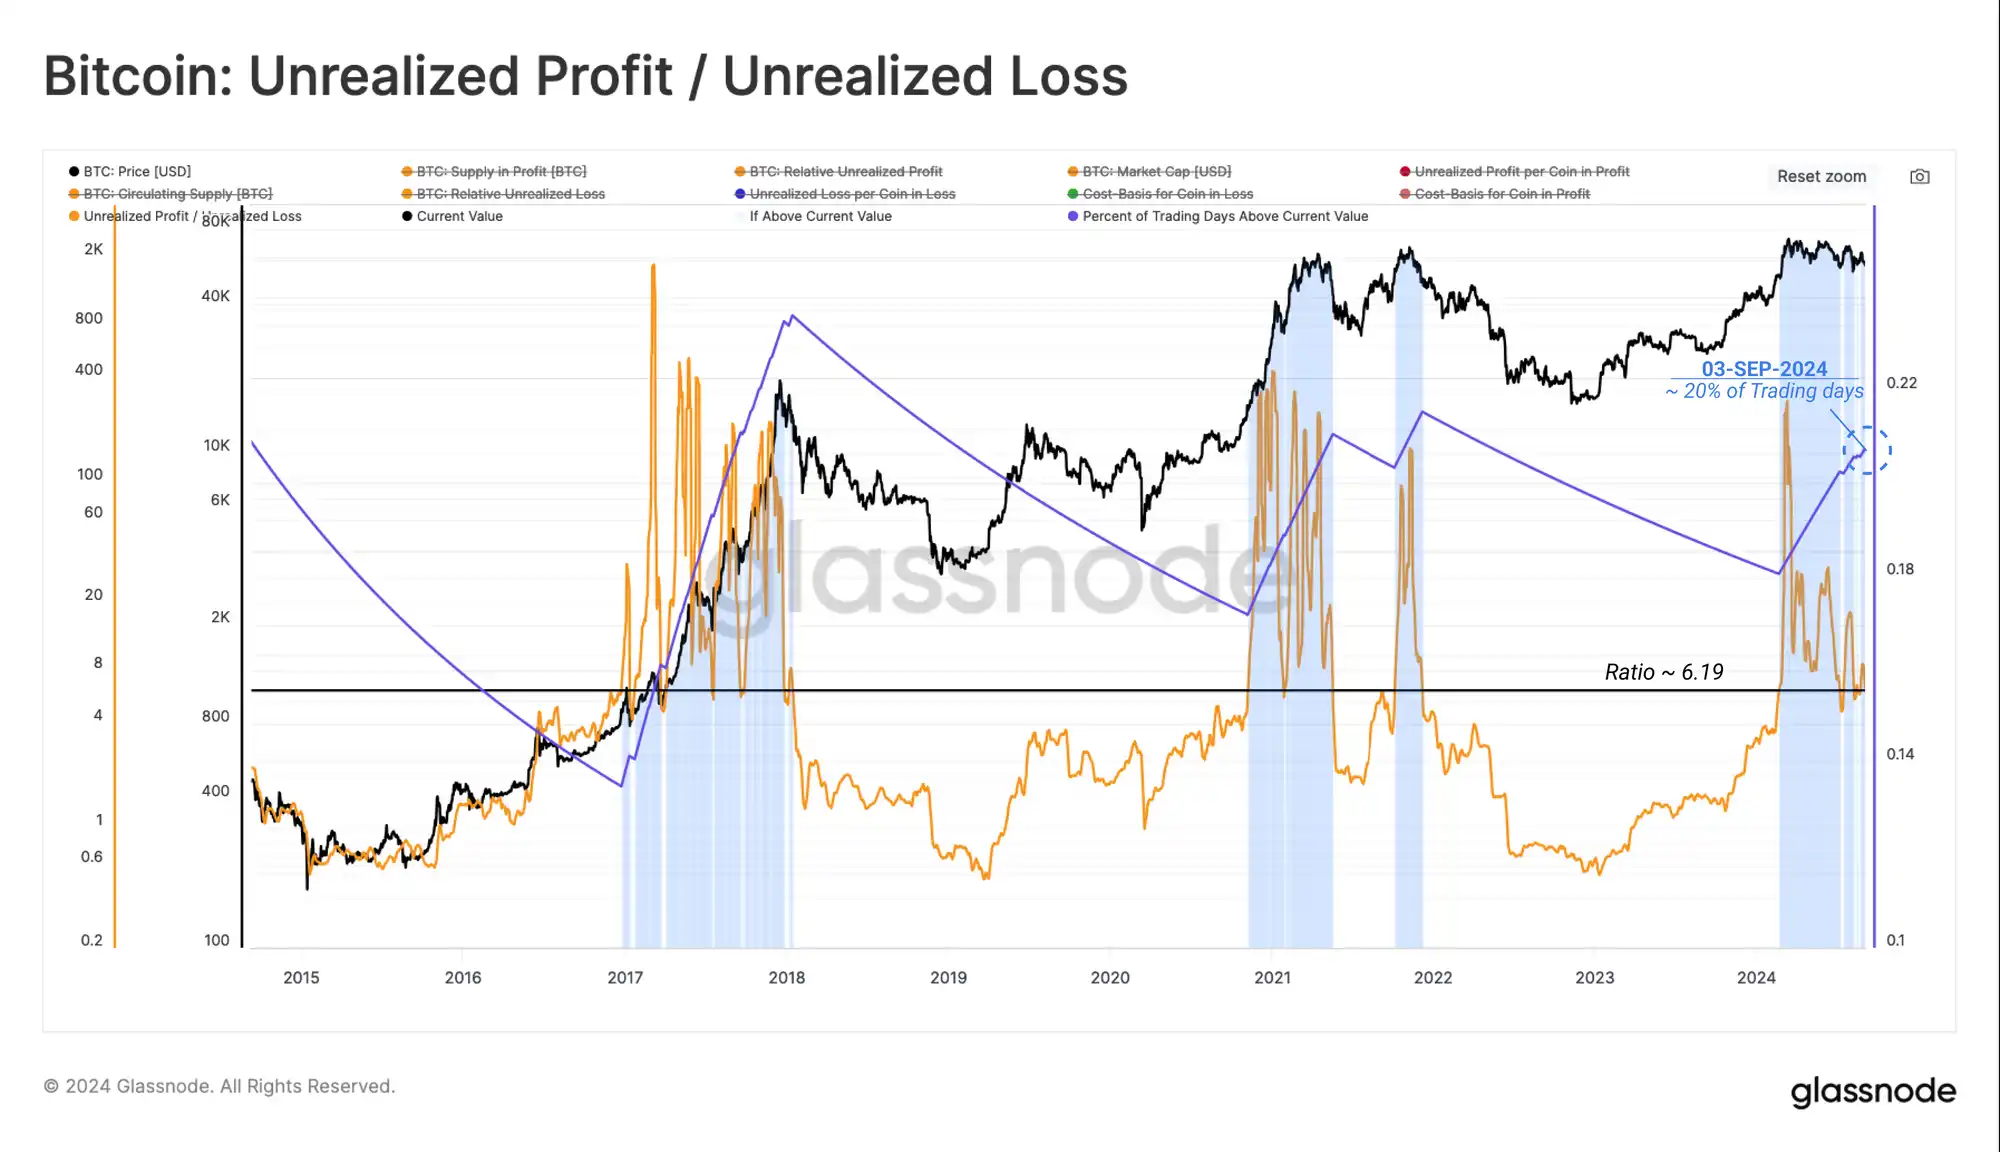
If we take the ratio of total unrealized profits to total unrealized losses, we can see that profits are still 6 times greater than total losses, supporting the above observations. The ratio is above its current value on about 20% of trading days, highlighting the surprisingly strong financial condition of the average investor.
Short-Term Concerns
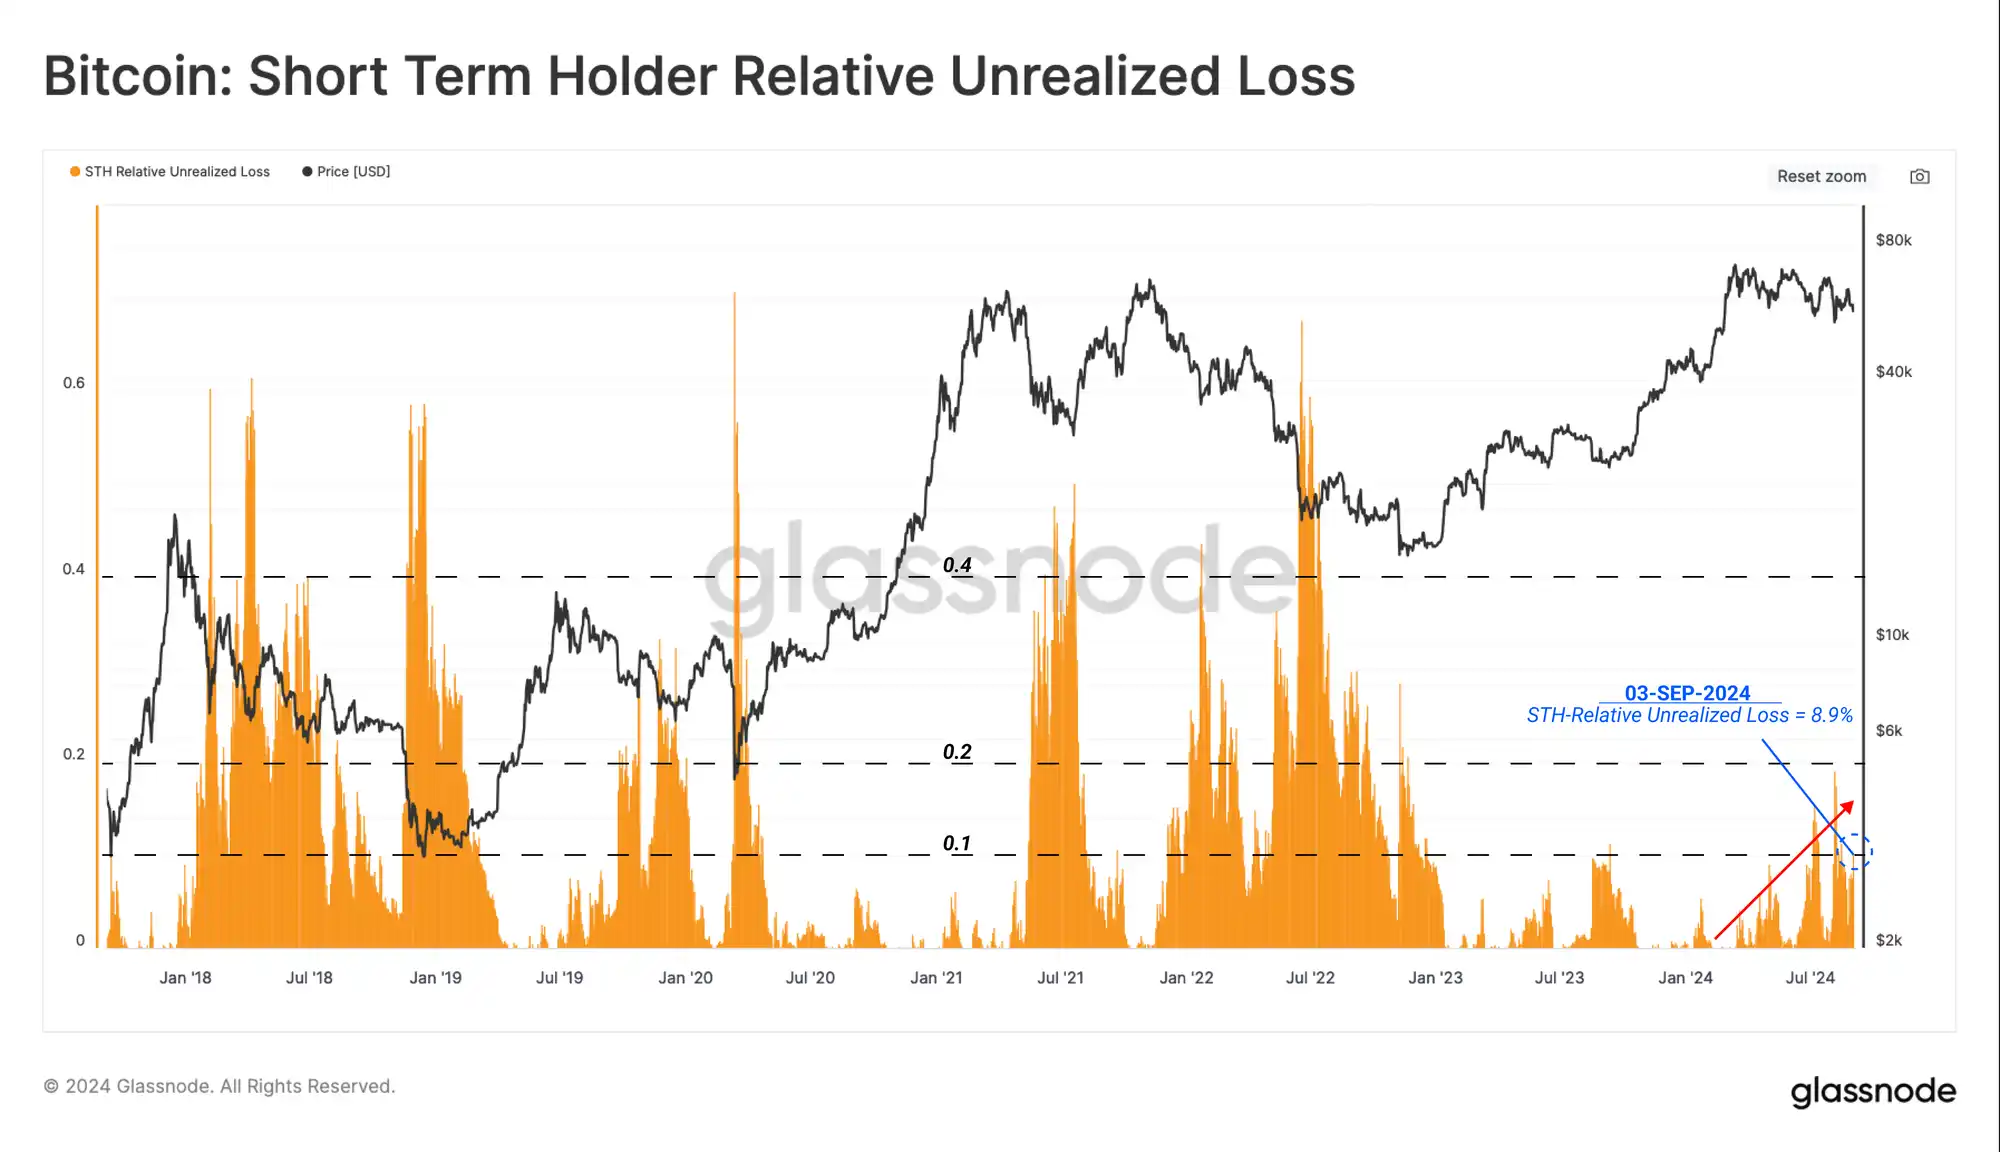
The group of short-term holders, representing new demand in the market, seems to be bearing most of the market pressure. Their unrealized losses dominate and have continued to increase in size over the past few months.
However, even for this cohort, the size of their unrealized losses relative to market cap is not yet in line with a full-blown bear market, and is closer to the turbulent 2019.
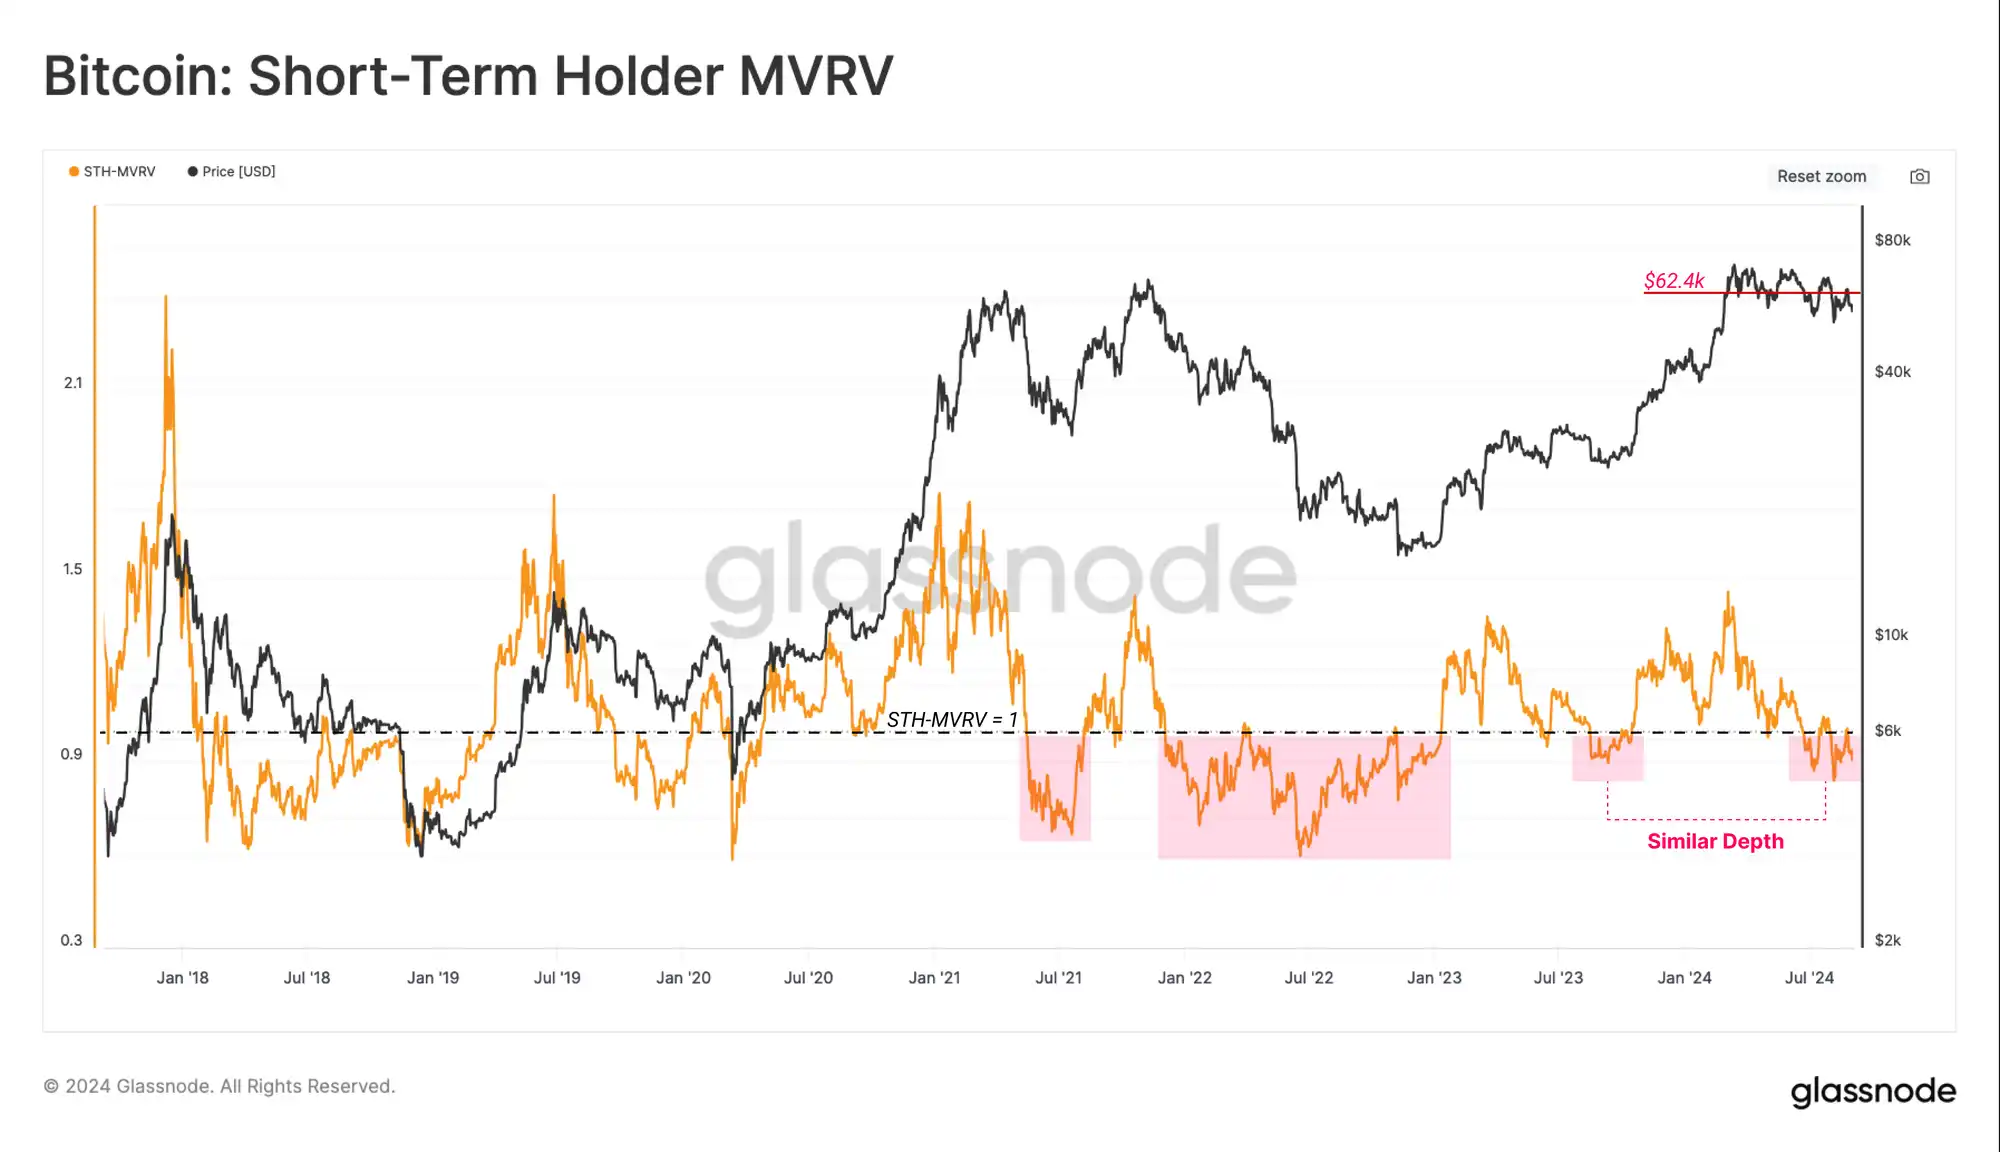
We can support the above observation by assessing the STH MVRV ratio, which has fallen below the breakeven value of 1.0. During the recovery rally following the FTX failure, the metric traded at levels similar to August 2023.
This tells us that the average new investor is holding unrealized losses. In general, the market is expected to weaken further before spot prices recover their STH cost basis of $62,400.
We can increase confidence in this assessment by examining a subset of the STH investor population. Currently, all age groups in the STH cohort are holding unrealized losses with an average cost basis of: · 1 d-1 w: $59.0 k (red) · 1 w-1 m: $59.9 k (orange) · 1 m-3 m: $63.6 k (blue) · 3 m-6 m: $65.2 k (purple) 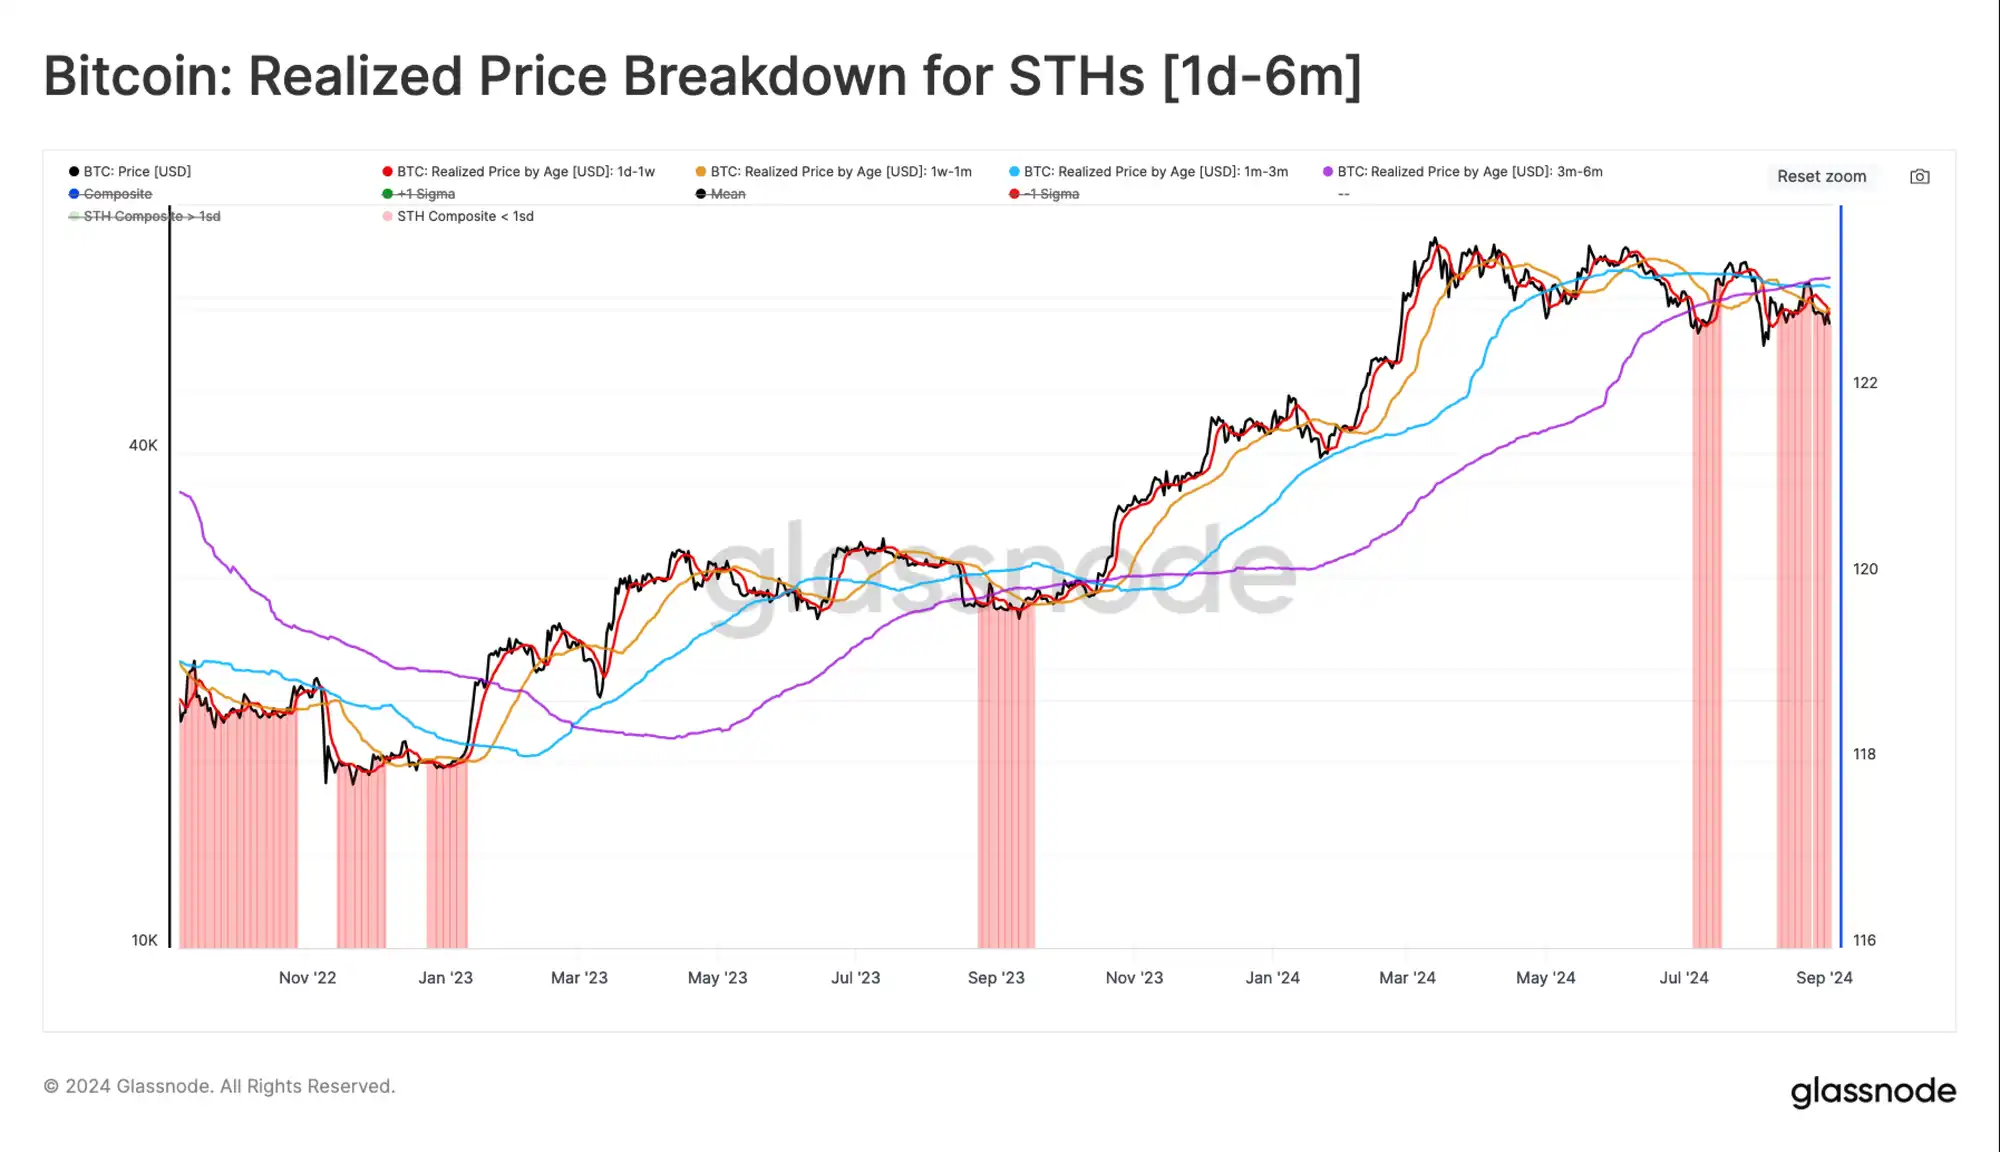 Investor Reaction Assessing unrealized losses can provide insight into the pressures investors in the market are facing. We can then supplement this analysis with realized profits and losses (locked-in) to better understand how these investors are responding to this pressure.
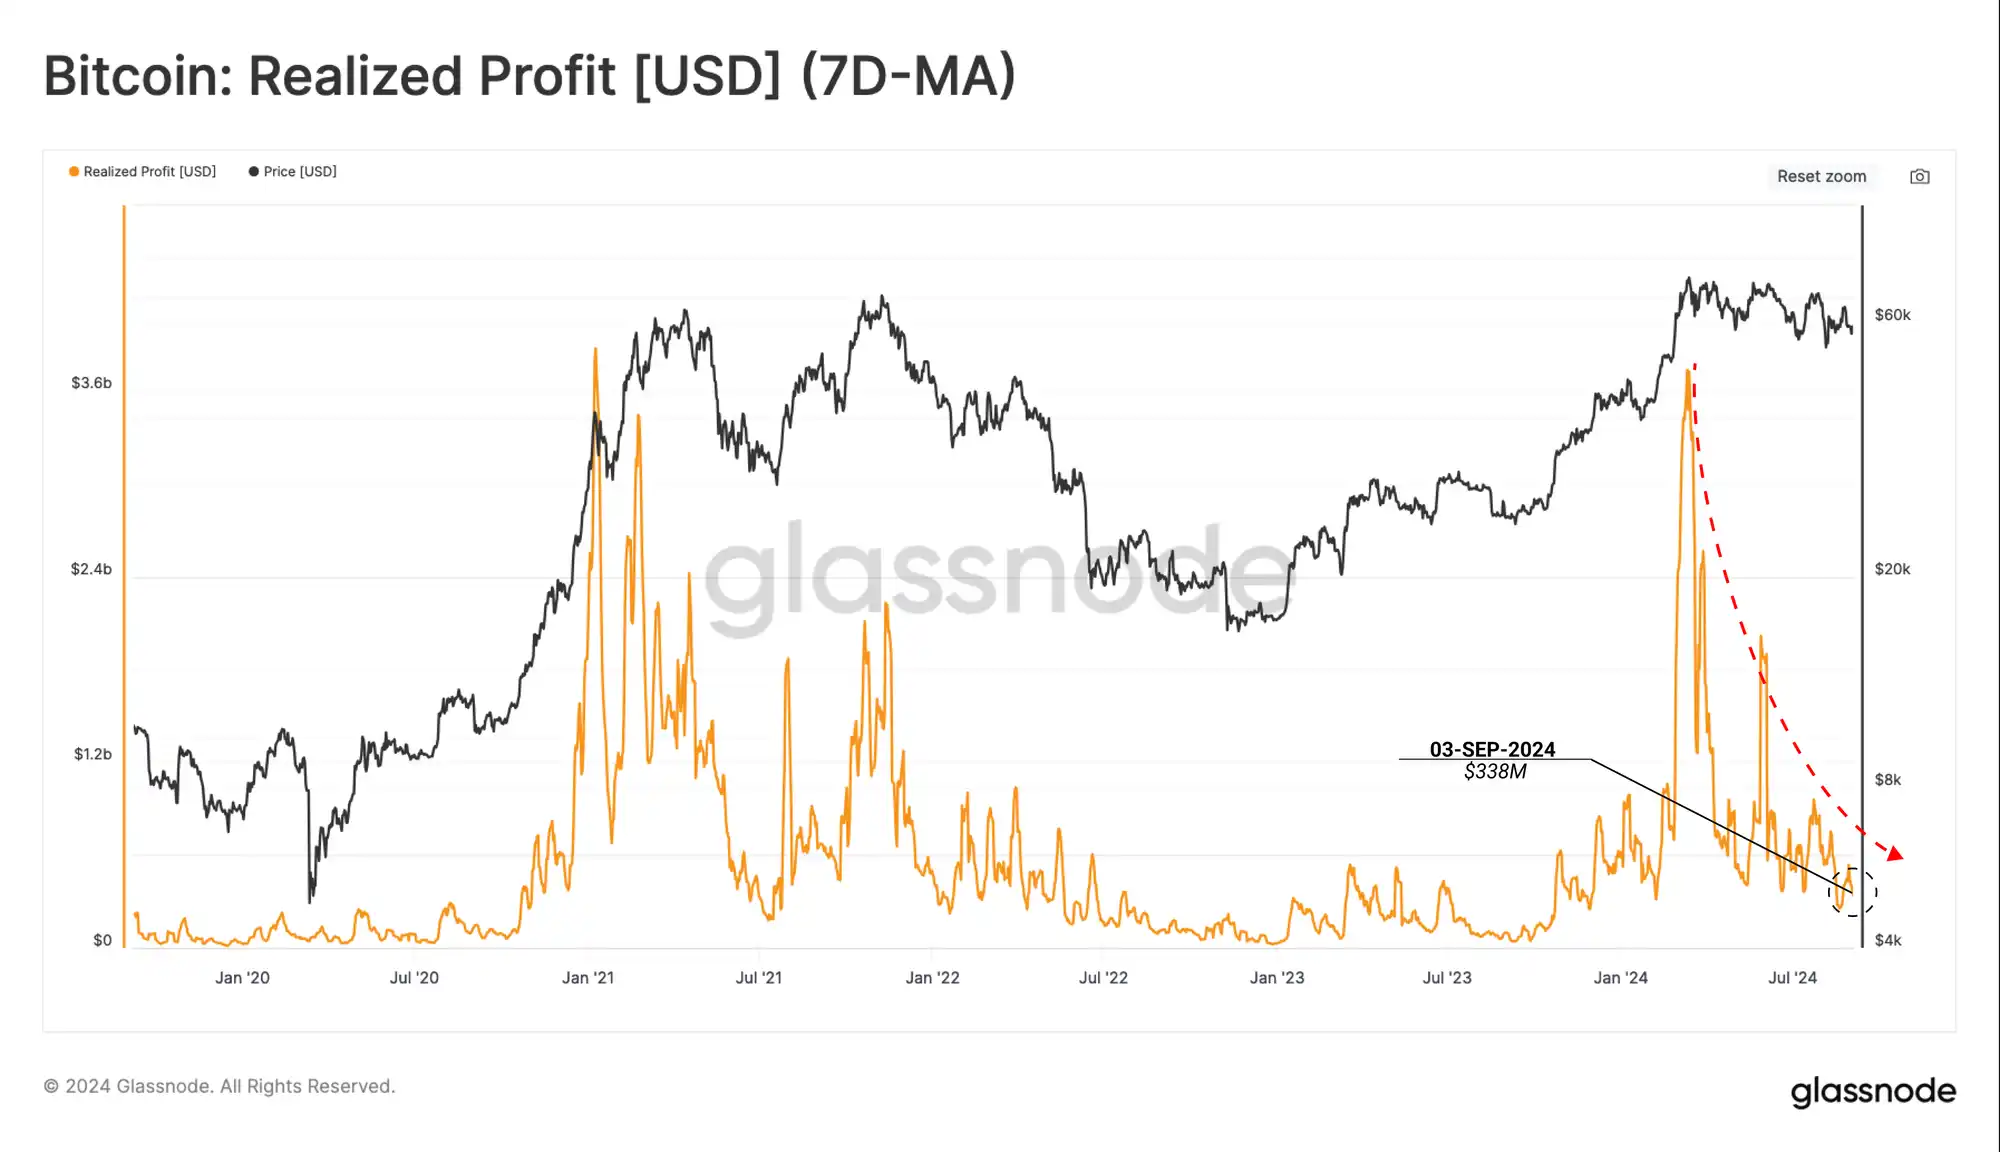
Starting with realized profits, we can see that there has been a significant drop off after the all-time high of $73,000, suggesting that most of the tokens spent since then have locked up smaller and smaller amounts of profit.
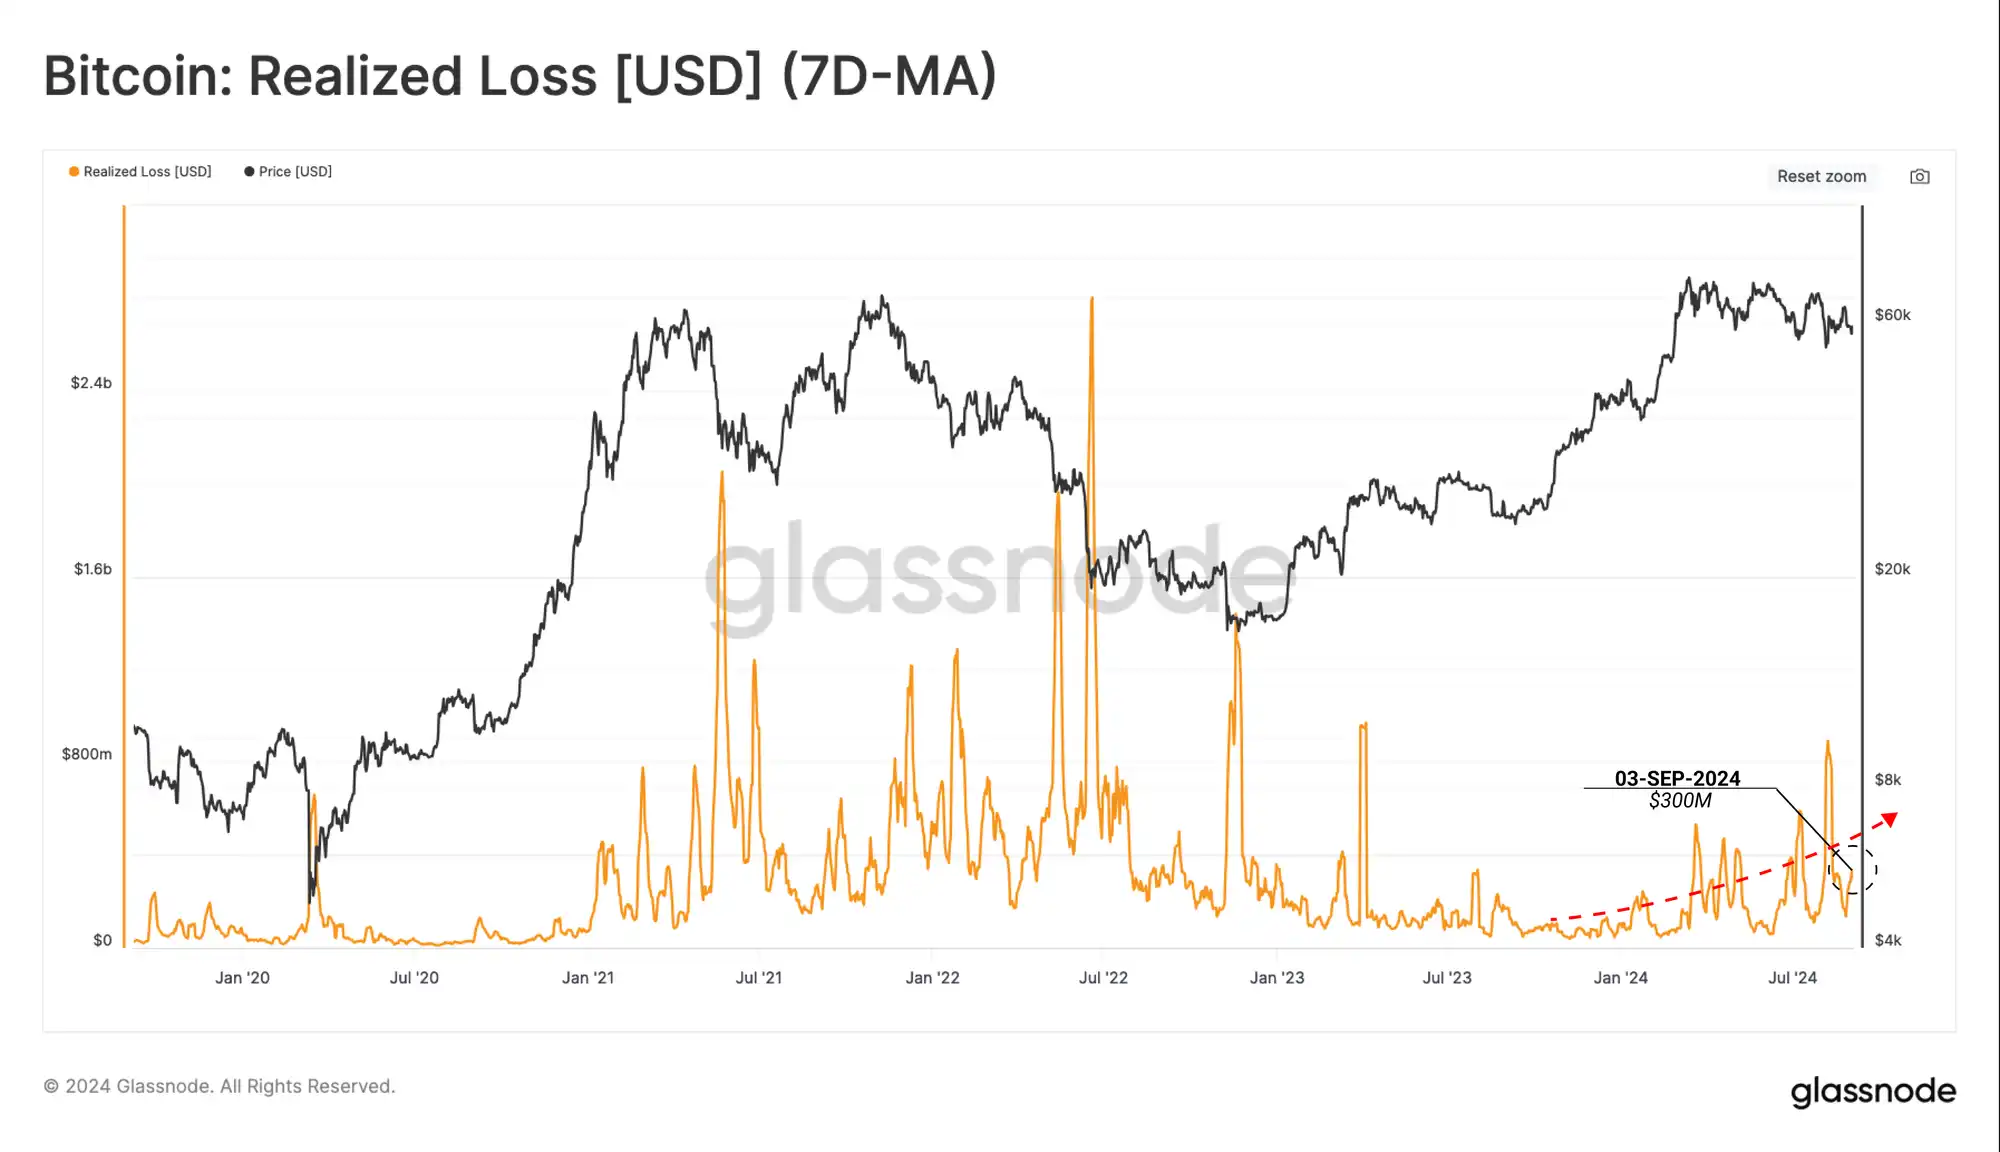
Moving to realized losses, we notice an increase in loss events, with volume rising to higher levels as the market moves down.
Loss events have not yet reached the extreme levels seen during the mid-2021 sell-off or the 2022 bear market. However, the gradual move higher does suggest that some fear is creeping into investor behavior patterns.
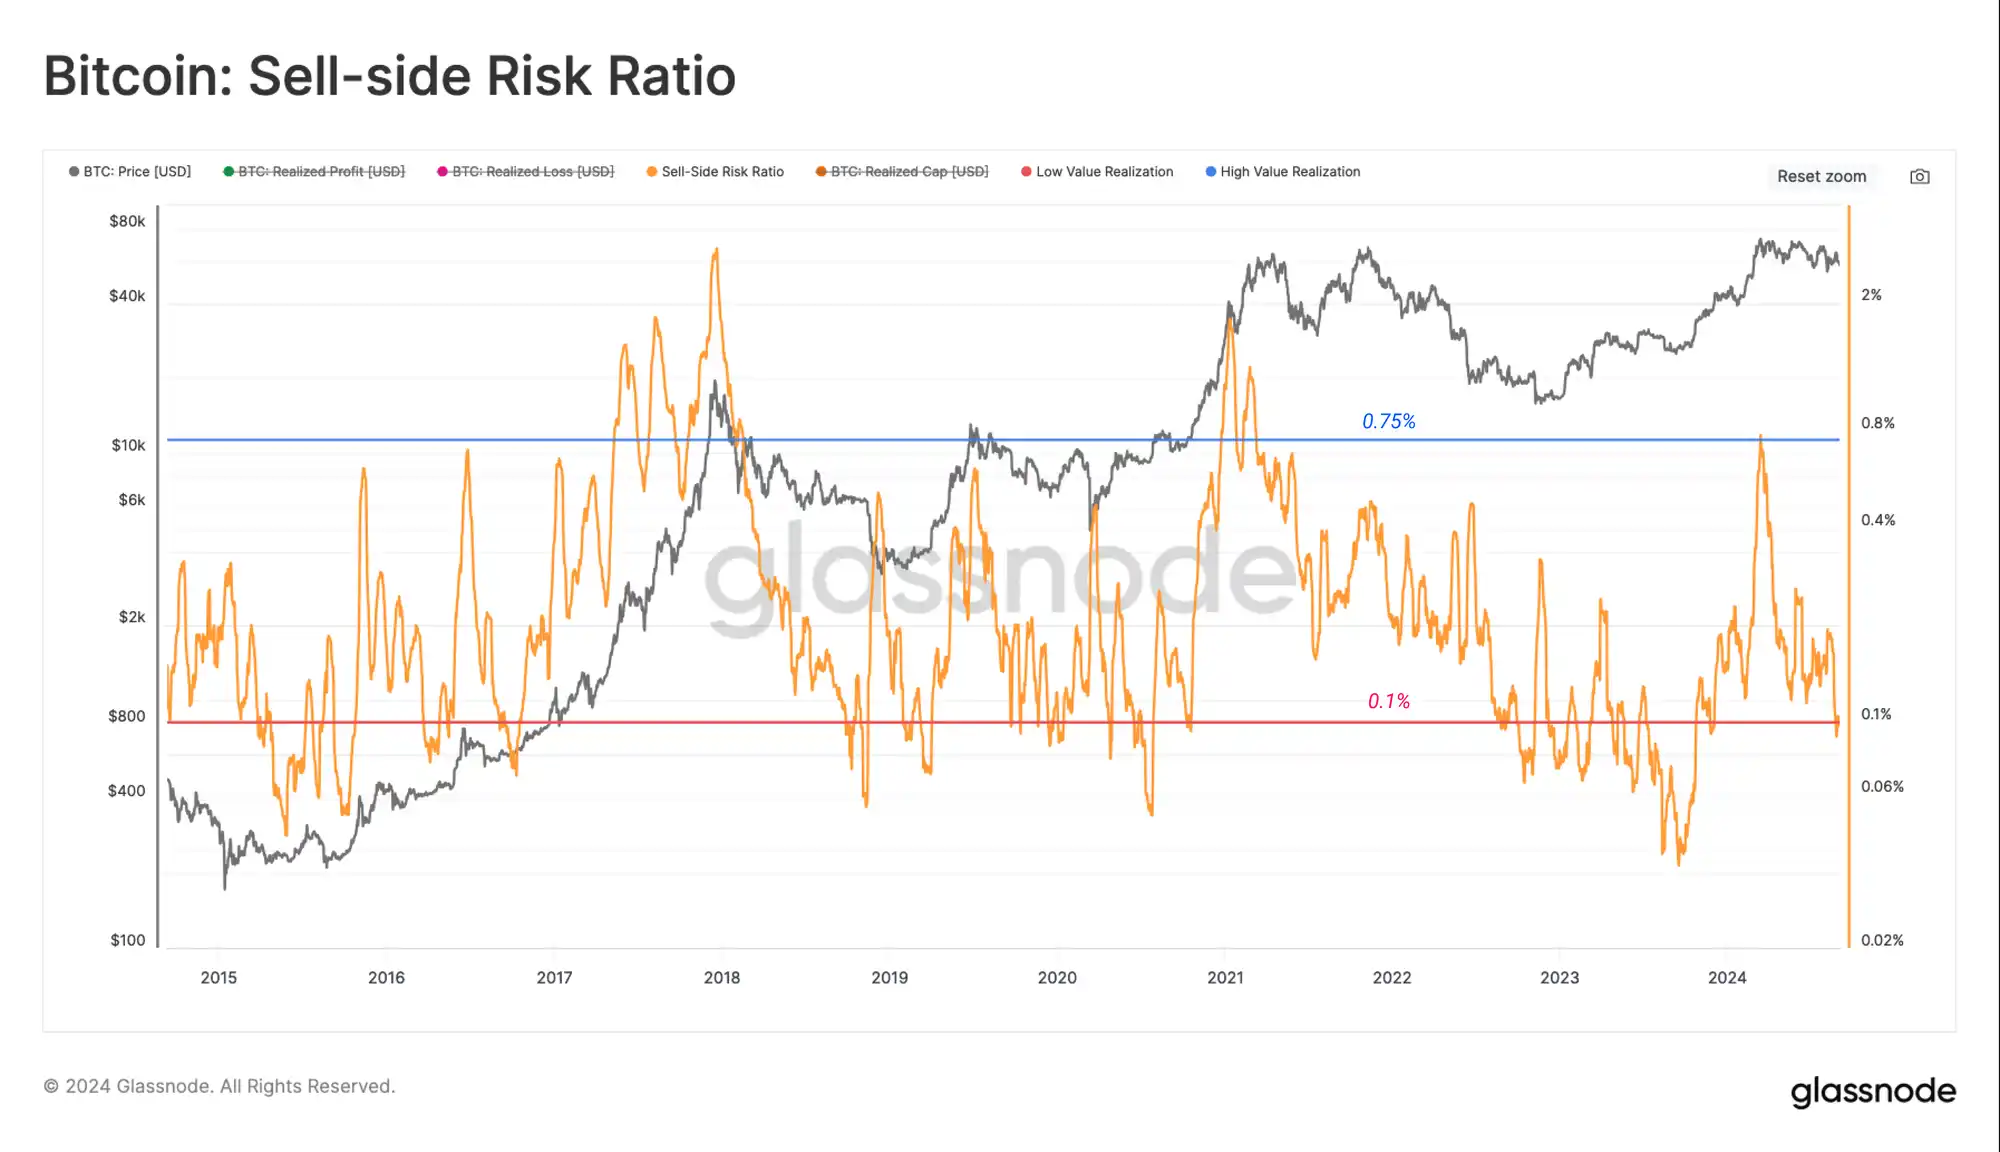
Looking at the sell-side risk ratio, we can see that total realized profits and losses are relatively small compared to the overall market size. We can interpret this metric under the following framework:
High values indicate that investors are spending tokens at large profits or losses relative to their cost basis. This situation suggests that the market may need to re-find equilibrium and will generally follow high volatility price action.
Low values indicate that most tokens are spending relatively close to their breakeven cost basis, indicating that a degree of equilibrium has been reached. This situation generally indicates that the "profit and loss" within the current price range has been exhausted, and generally describes a low volatility environment.
The sell-side risk ratio has fallen to a low level, indicating that most tokens traded on-chain are trading very close to their original acquisition price. This indicates that profit and loss activity is gradually saturated within the current price range.
Historically, this suggests expectations of increased volatility in the short term, similar to what was seen in 2019.
Riding the Cycle
In a downtrend, patience and holding become the dominant market dynamics. A large number of long-term holder tokens were spent to earn profits from the March ATH, creating a net oversupply.
Recently, LTH has slowed the pace of profit taking, with the supply accumulated during the ATH run maturing into long-term holders. However, historical examples of LTH supply increases like this suggest that this typically occurs during transitions to bear markets.
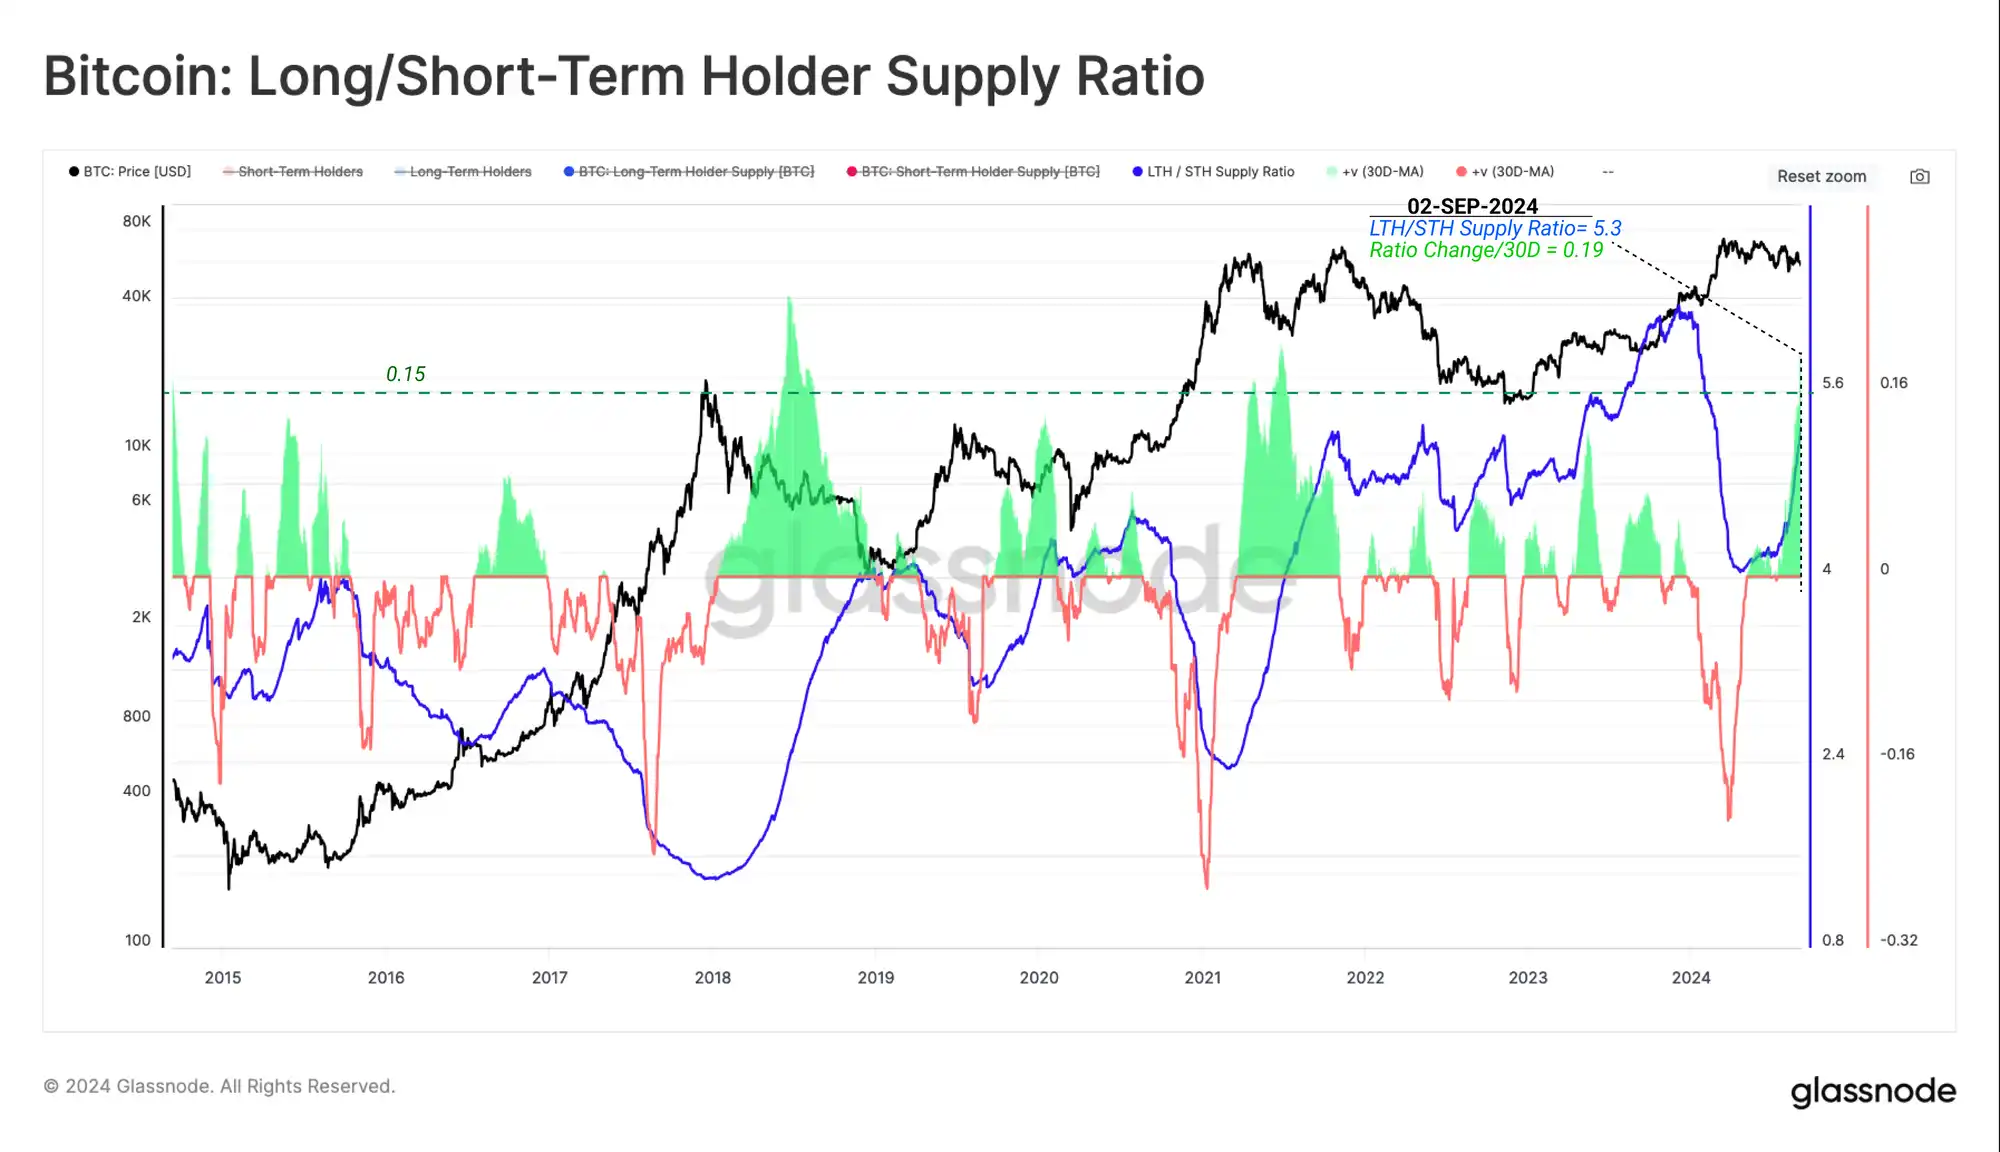
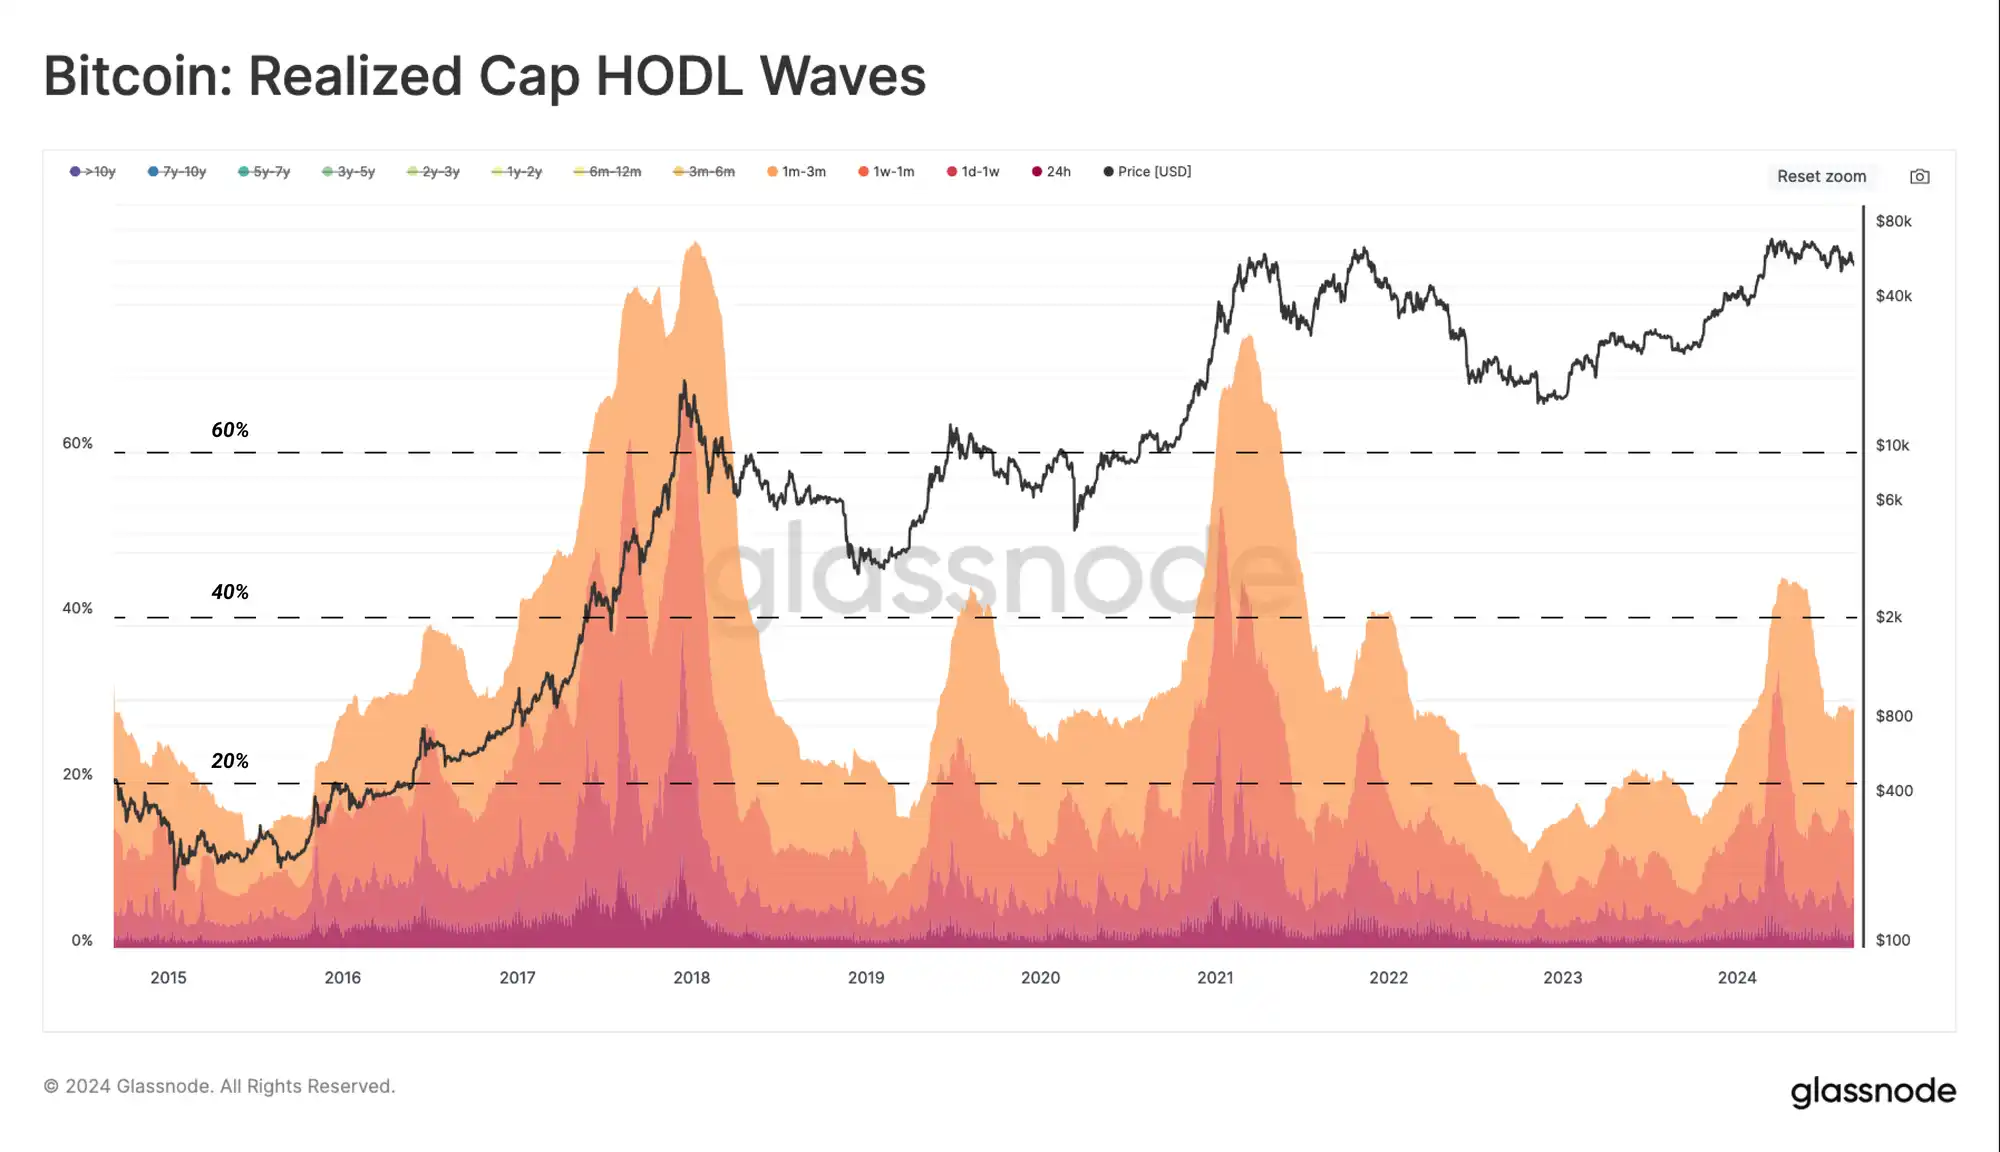
Combined with the above observations, we note that the wealth held by new demand investors has declined in recent months as tokens mature and turn into long-term holders.
The percentage of wealth held by new investors has not reached the high limits experienced during previous ATH distribution events. This may indicate that the 2024 peak is more in line with the mid-cycle highs of 2019 rather than the macro highs of 2017 and 2021.
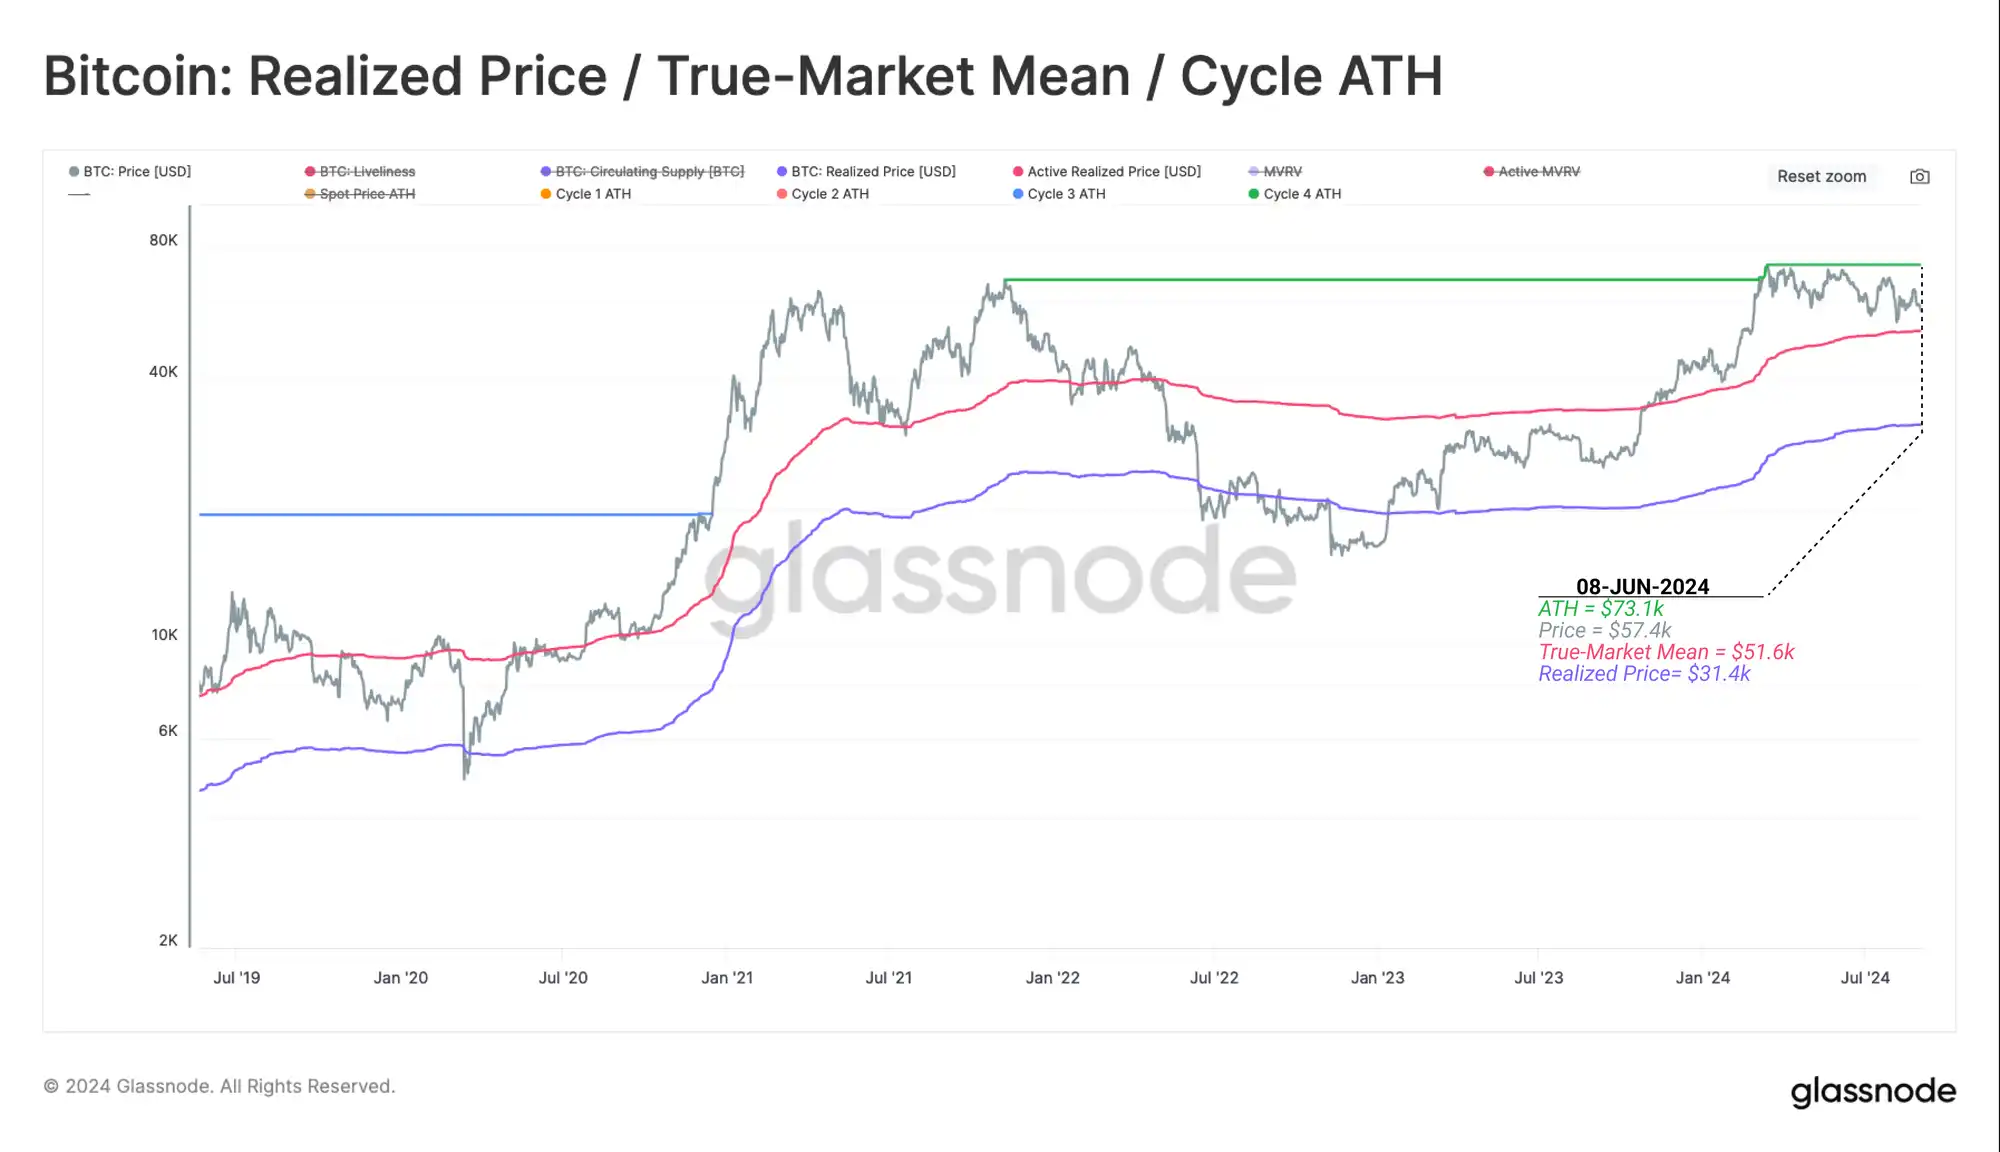
To summarize our analysis, we will refer to a simplified framework for thinking about historical Bitcoin market cycles using key on-chain pricing levels:
· Deep Bear Market: Price is below the actual price. (Red)
· Early Bull Market: Price trades between the actual price and the true market mean. (Blue)
· Enthusiastic Bull Market: Price trades between the ATH and the true market mean. (Orange)
· Euphoric Bull Market: Price is above the ATH of previous cycles. (Green)
Price action remains within an enthusiastic bull market structure in this framework, which is a constructive observation. However, in the event of a localized downturn, the $51,000 pricing level remains a key area of interest that must hold for further appreciation.
Summary
Bitcoin has now retreated only 22% from its all-time high, a much smaller decline than previous cycles, and the average BTC investor remains quite profitable, highlighting the robustness of their holdings.
Nevertheless, the short-term holder group continues to carry elevated unrealized losses, indicating that they are the primary risk group and the expected source of sell-side pressure in a downturn.
Apart from this, profit and loss activity remains very minimal, indicating that our current range is saturated, and key indicators such as the sell-side risk ratio are also saturated, hinting that volatility may increase in the near term.
Welcome to join the official BlockBeats community:
Telegram Subscription Group: https://t.me/theblockbeats
Telegram Discussion Group: https://t.me/BlockBeats_App
Official Twitter Account: https://twitter.com/BlockBeatsAsia