Forum
Forum Finance
 Specials
 On-chain Eco
 Entry
Entry
 Podcasts
 Activities
 OPRR
OPRR

Altcoins enter "IQ50" mode, is BTC about to reach a new high? | Trader Observation

On the evening of October 21, BTC broke through the 69,000 mark and reached a high of 69,500 US dollars. BTC was basically sideways throughout the weekend, with a lack of liquidity. Why did it suddenly rise during the US trading time on Sunday? Was this rise driven by futures or spot purchases?
Recently, there have been frequent positive news for altcoins, starting with APE, to DYDX and SUSHI. After the good news was issued, many altcoins have seen an increase of more than 20%. The bottom altcoins have gradually moved. Can the altcoin engine oracle sector of the bull market in October last year lead the altcoins out of a bull market this time? Is it really bullish this time? Let's take a look at the views of traders from various angles.
Technical Analysis
@leon_li2
From the K-line chart, BTC seems to have broken through the downward trend line of more than half a year, and it seems to be setting new highs every day, but the trading volume of the new highs has shrunk significantly; on the other hand, ETH broke through the previous high, but it has only reached the real pressure range of 2800. ETH's increase yesterday brought high market sentiment. For the first time, the contract price was higher than the spot price. Therefore, it is believed that the bull market is at its end and the building will collapse at any time.
Many people compare the current market with October 23, and think that they are all weekly MACD golden crosses, and the weekly K line breaks through the previous high, but I think the current market sentiment is completely different from the market sentiment at that time. At that time, it was unanimously bearish, and now it is unanimously bullish. I don’t think the MACD golden cross here has any practical significance. After all, after the golden cross, it can be dead cross immediately. Who is right and who is wrong, let’s see whether it will repeat the big positive line in 23 years this week to set a new high.
As for when I will stop being bearish, it will probably be after ETH effectively breaks through 2820 after consolidation. At present, I have no short positions. I am looking for the right entry opportunity to short.
@Crypto_Painter_X
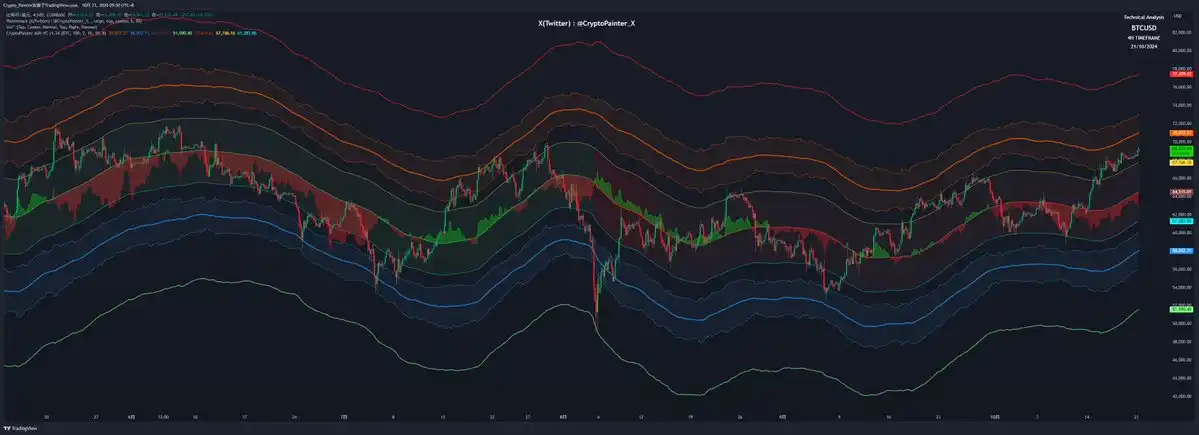
From the perspective of the ASR-VC 4-hour channel, the current price behavior is somewhat similar to the pattern at the end of September, and continues to run near the average pressure zone. It may be either accumulating momentum or running out of momentum. From the perspective of spot premium, this is a bit like the market in early June, with a long-term bullish trend under a negative premium. The key price for judging the full turn of the channel to a bullish trend is 71,000. If it breaks through the average pressure zone strongly, the first target may be near the overbought line, which is currently around 77,500.
@Patrade_Buer
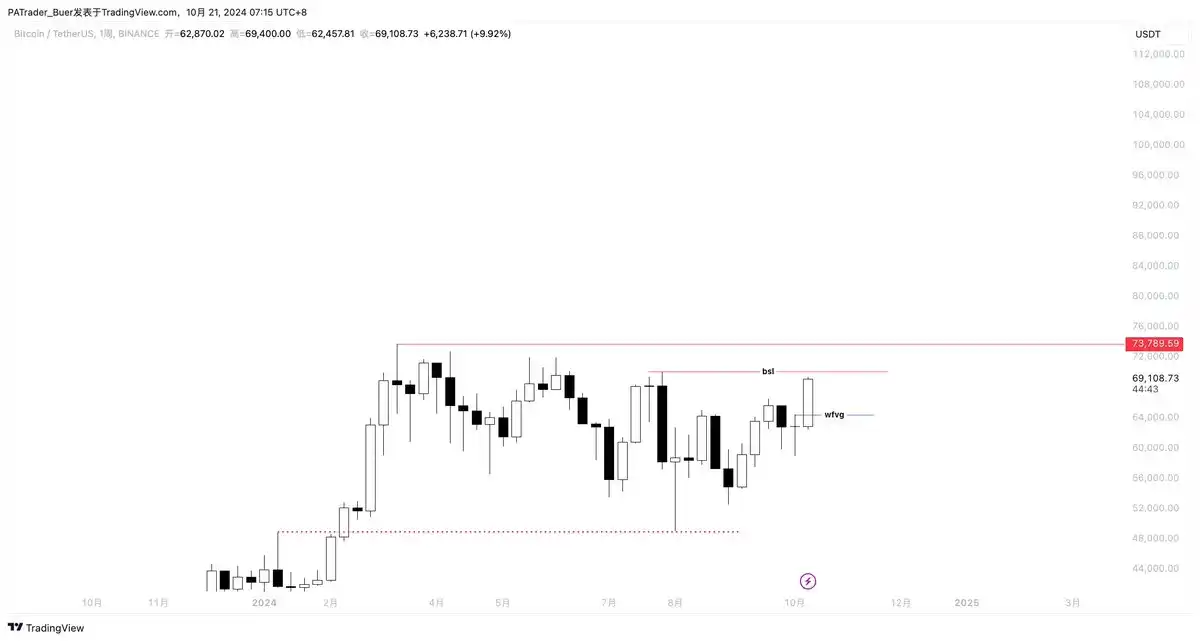
From the weekly perspective, the market continues to rise. BSL is currently waiting for plunder. This period of rising market must hit a new high. My personal goal is to start with 9. It is still within the range (the FVG gap in the shock range will generally be filled). Pay attention to whether there is a WFVG opportunity, which is around $64,500.
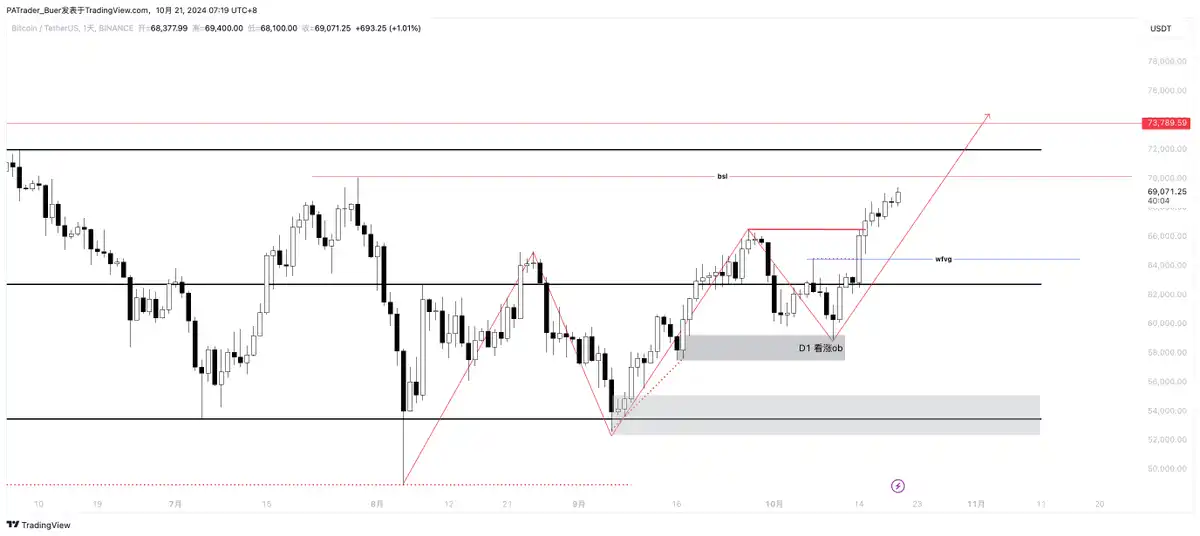
From the daily perspective, it continues to fluctuate and rise, mainly waiting for BSL to be plundered. If there is a callback opportunity for BTC, it will be around 645, so you must buy it. If BTC does not have many trading opportunities, look for trading opportunities in Shanzhai.
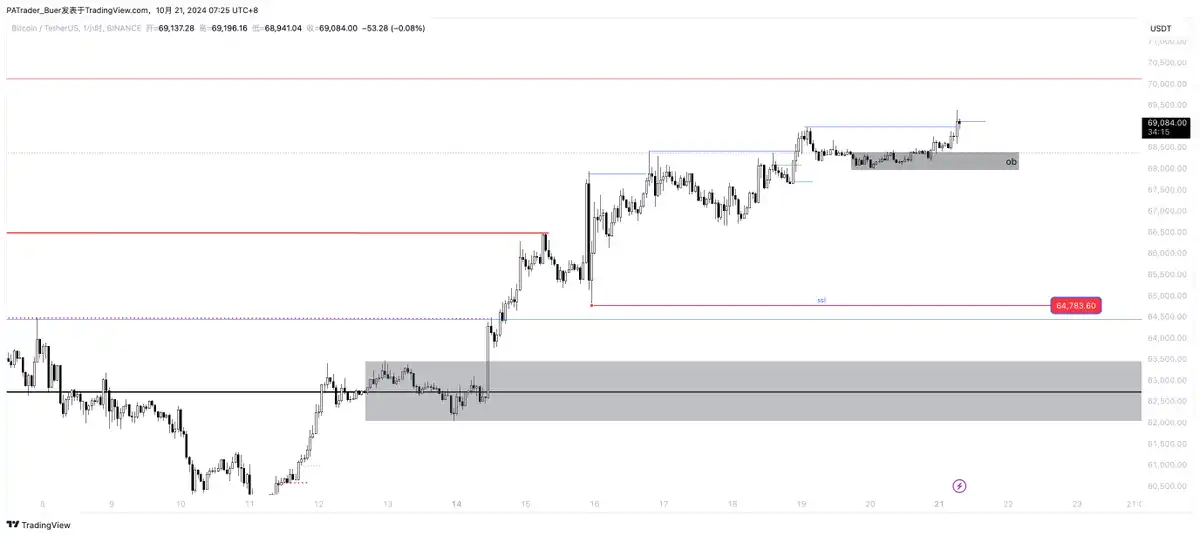
From the hourly level, it is fluctuating upward and constantly generating new highs. If it falls back and does not break OB, you can go short and long during the day. If it falls below OB, you can expect buying opportunities when it falls back.
@CryptosLaowai
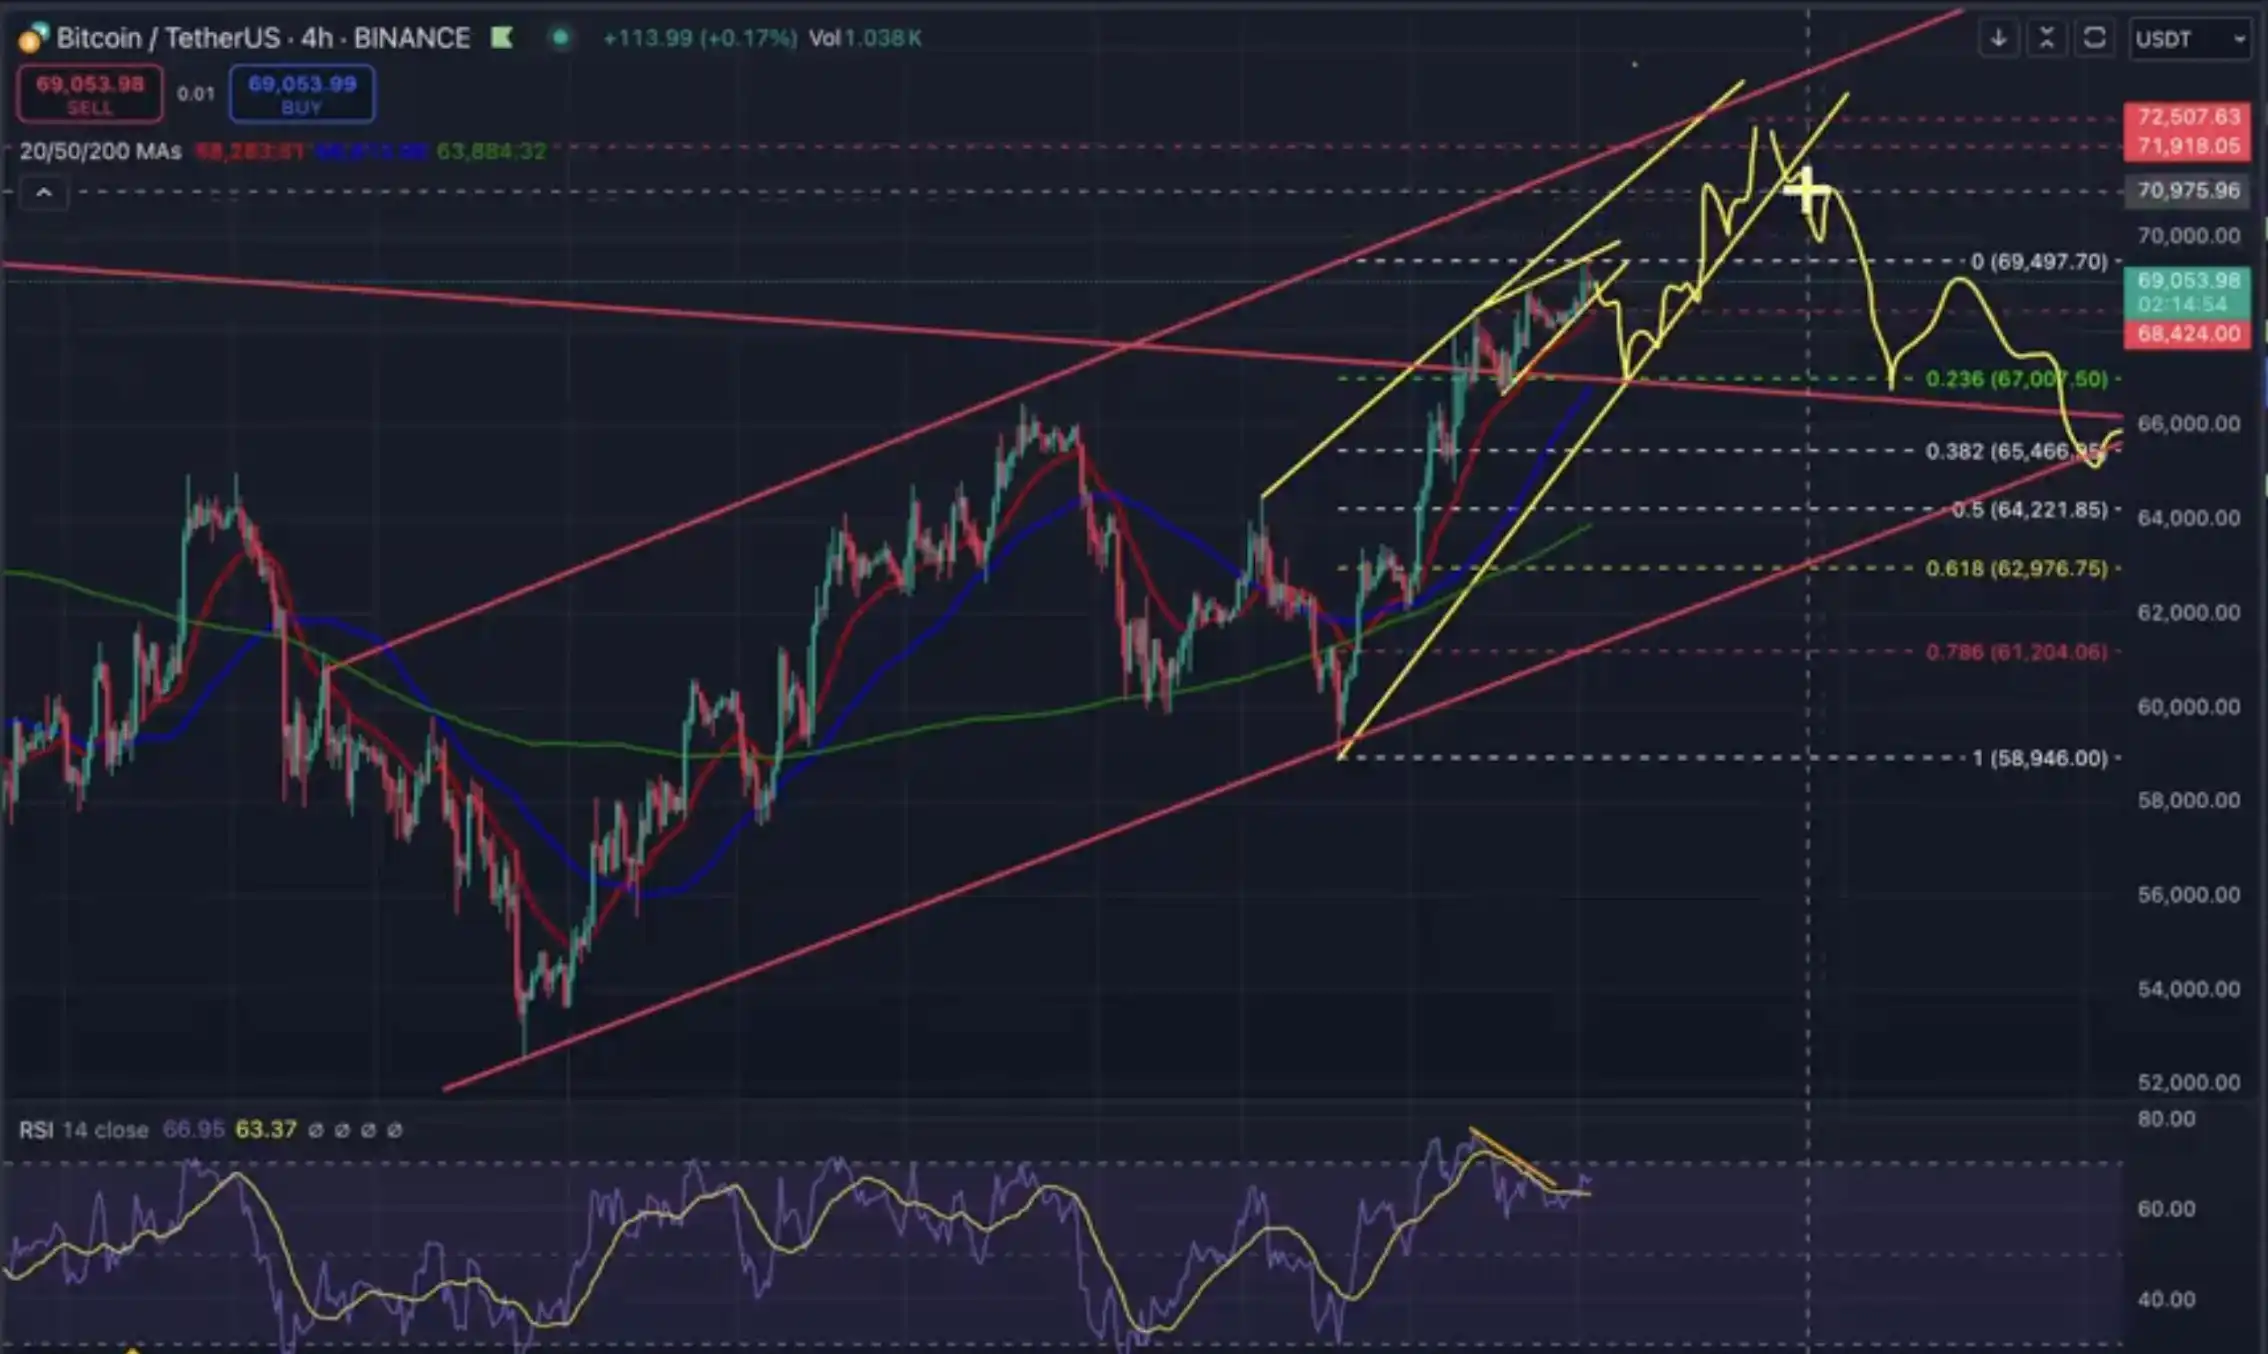
First of all, it is believed that the downward trend line of this round of large cycle has been broken, and the retracement has been successful, forming a bearish rising wedge at a small level. It is believed that it will weaken in the short term, and the decline will retrace to the downward trend line of the large cycle and the 0.236 Fibonacci retracement position of this round of business battles, which is roughly around 67,000 US dollars, forming a large-level rising wedge. The first target of this round of rise is still around 72,000 US dollars.
Data Analysis Party
@Kbeast.eth
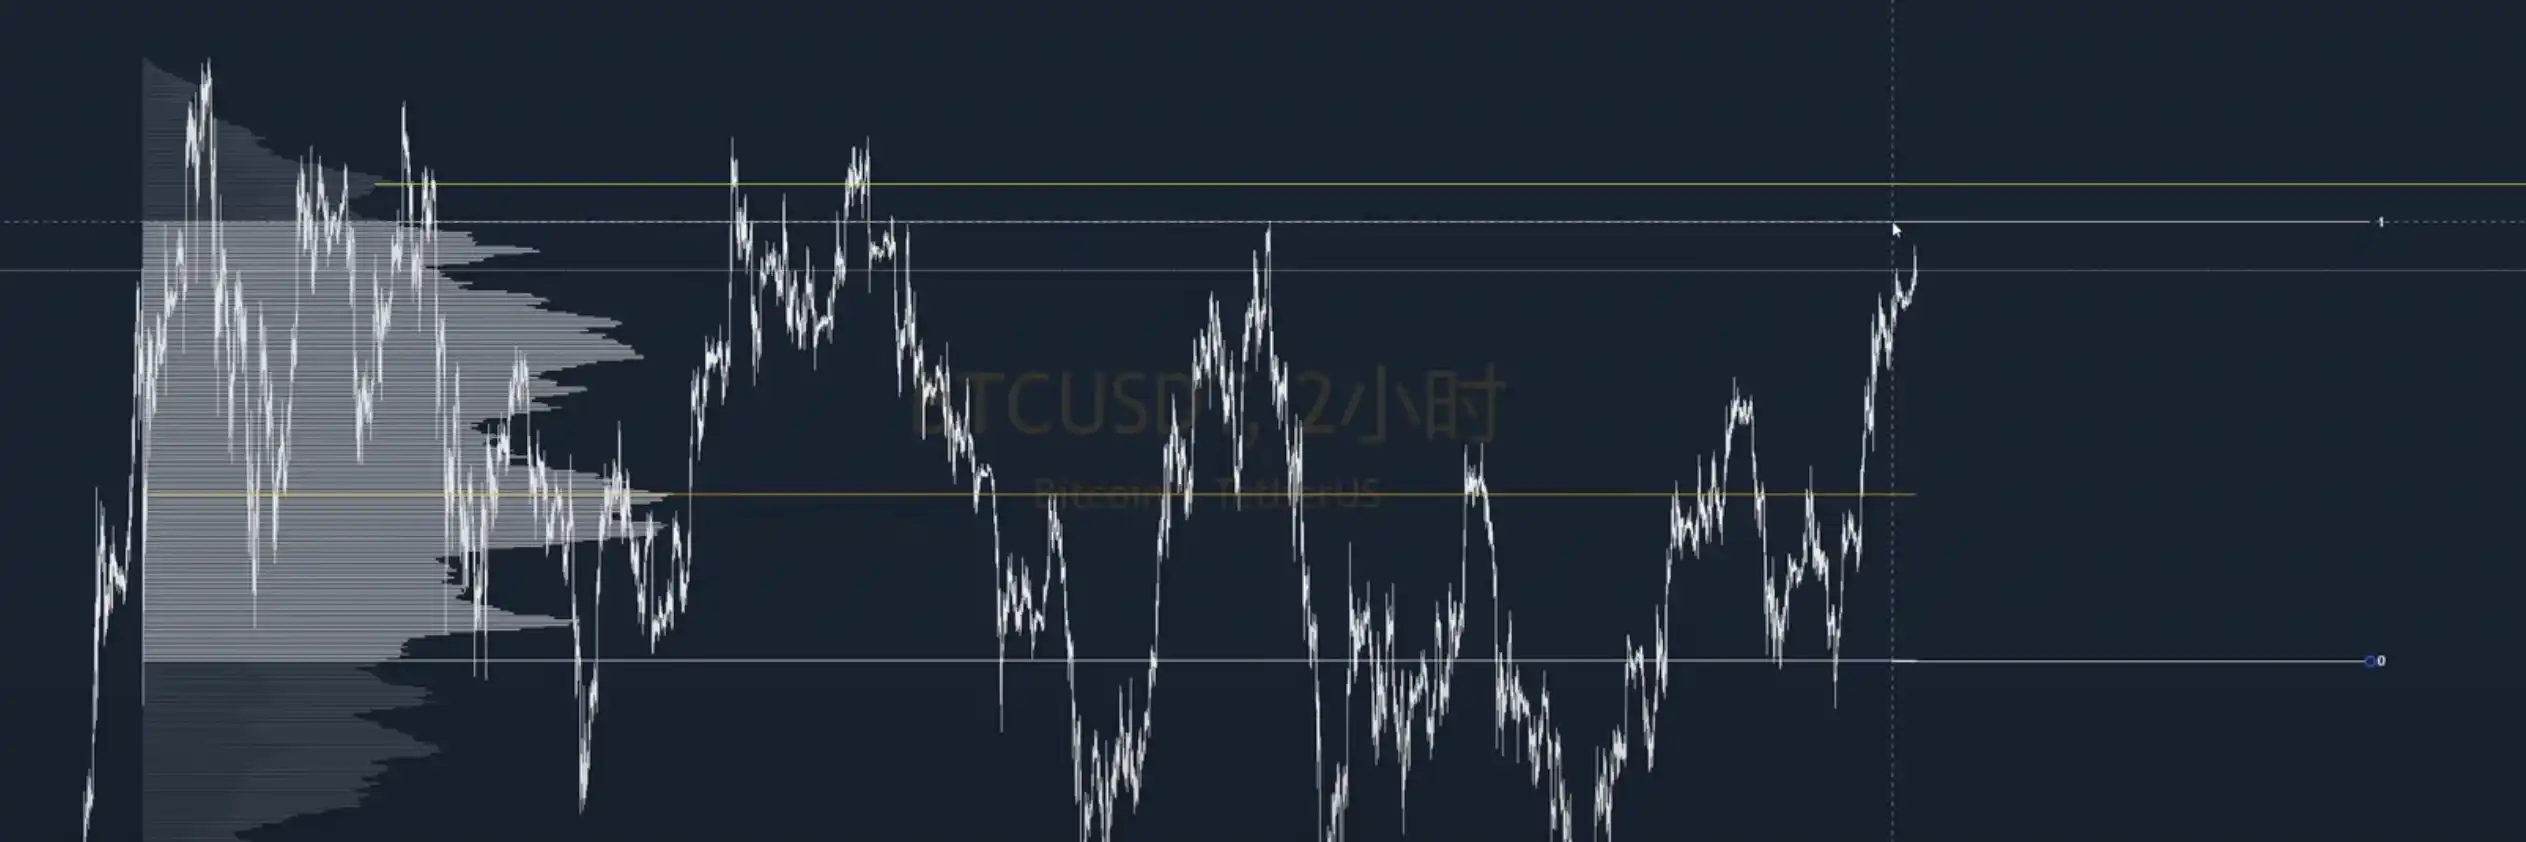
According to the value zone of BTC's wide fluctuations in the past six months, yesterday's upward breakthrough did not break through the VAH of the past six months. In addition, the thickest distribution, that is, the largest supply area, is at 70,900. If it can continue to rise and there is no upward auction rejection, the next target of the rise is 70,900.
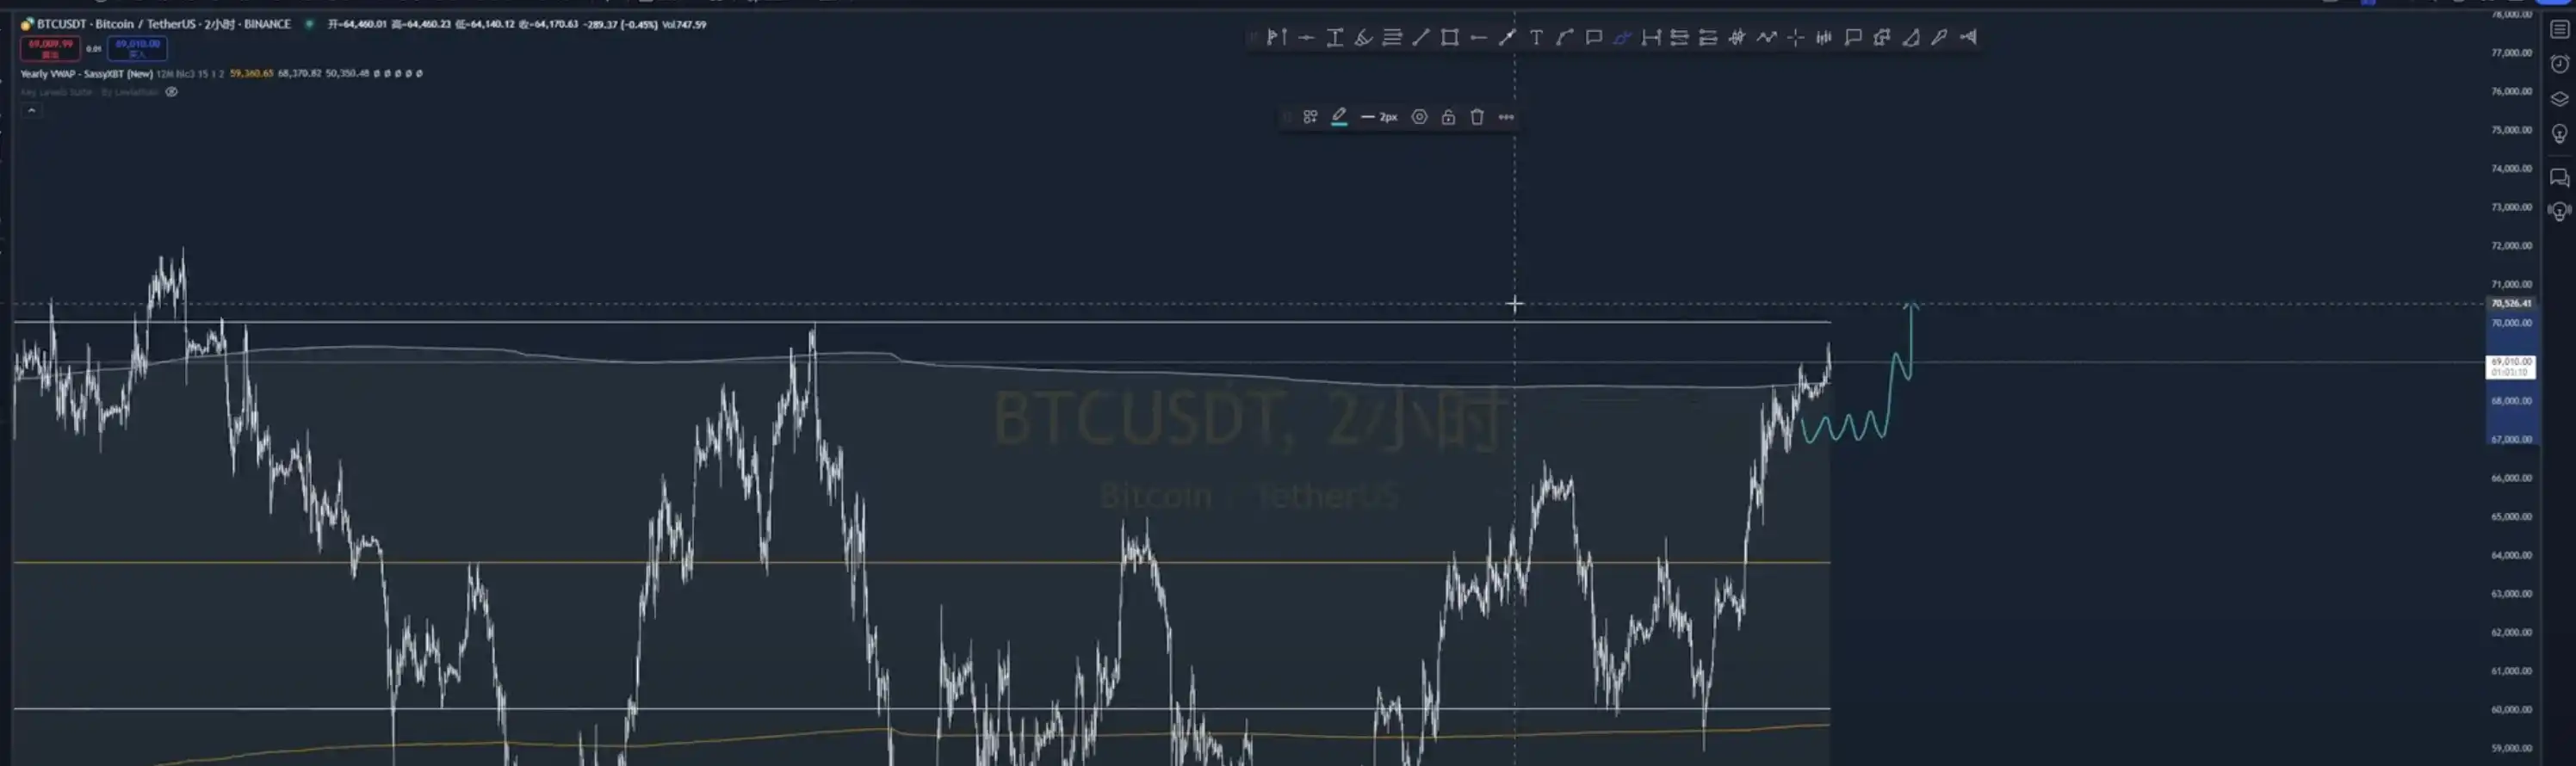
From the perspective of annual VWAP, it has accumulated momentum and has not shown a clear downward drive, but has fallen back without breaking. Therefore, it is believed that it will continue to break upward in the short term. According to the buyer's liquidity depth chart and liquidation heat map, a key position for downward correction is about US$65,000-67,000.
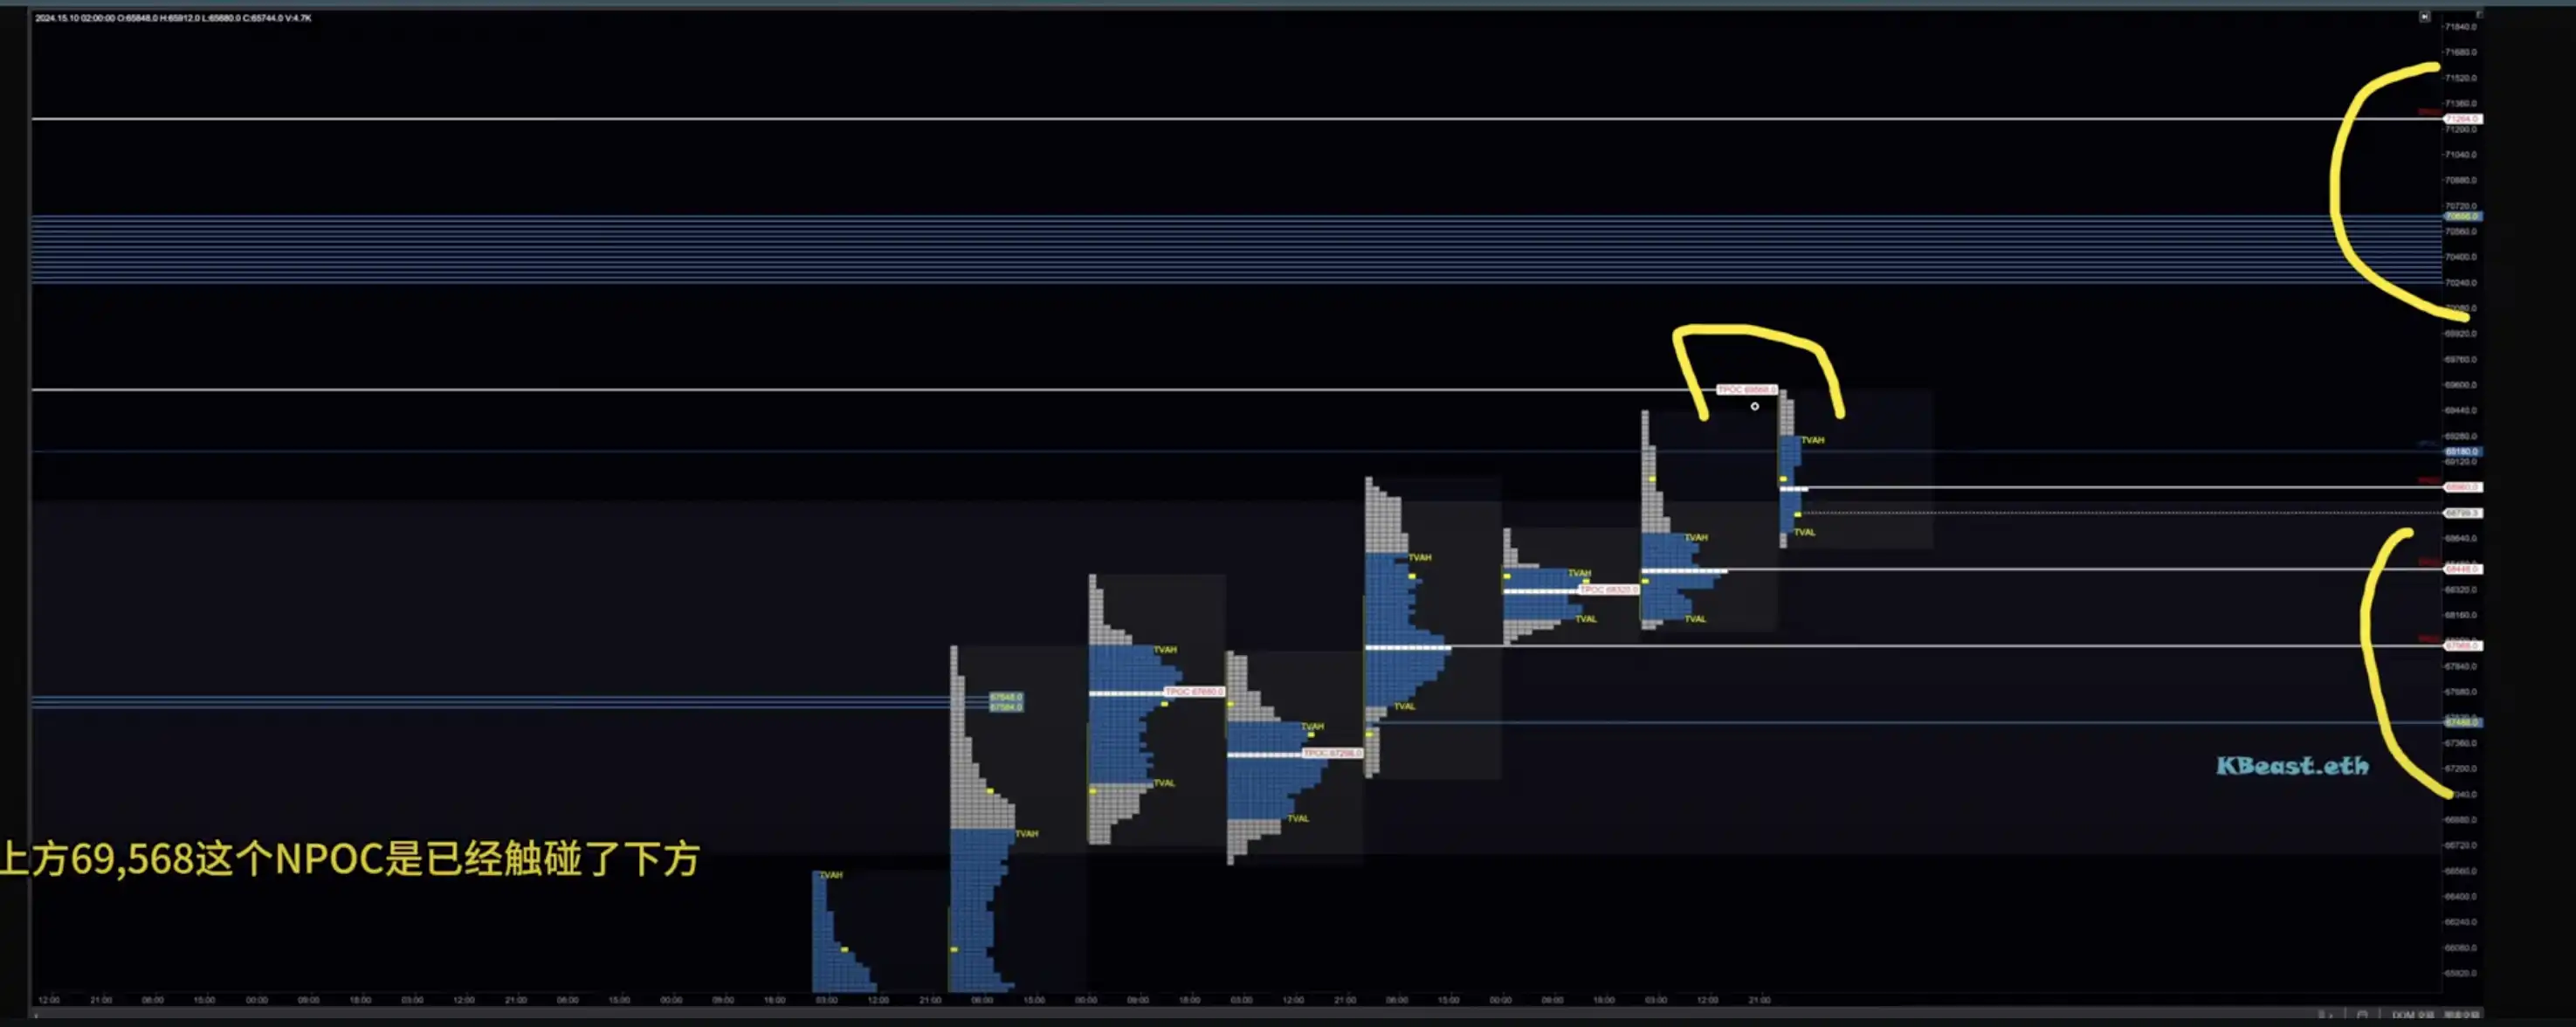
Observing the auction format during the day, it is a very obvious upward auction structure. It also conforms to the view of continuing to break upward, so we can continue to be bullish.
@LinChen91162689
@Crypto_Painter_X
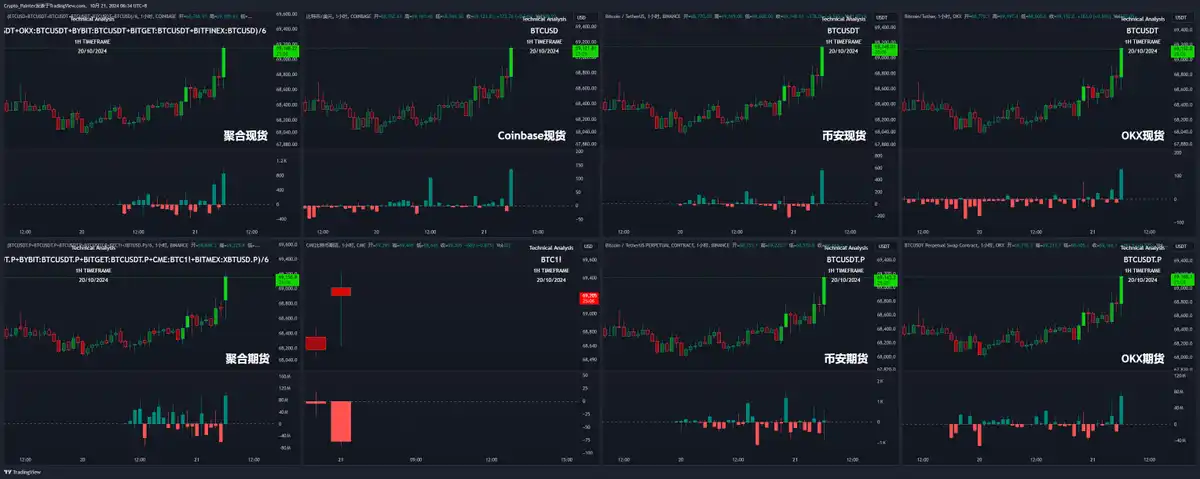
From the data level, spot: aggregated spot maintained a small sell-off on Sunday night, but began to increase in volume on Monday morning, and the rise was divided into 2 times; futures: aggregated futures first saw continuous small selling from Sunday night to Monday morning. In the first spot rise, it was still closing longs and shorting, but the second time it completely broke through 69,000 and turned to long; it seems that the short position was based on 69,000 It may be a false breakthrough idea. The market entered from the left side, and then was stopped by strong spot buying. It is worth noting that Coinbase changed its previous state of continuous shipments from Sunday, and began to buy in small amounts continuously, which is a relatively big change. However, except for three times of obvious buying with volume increase, Binance Futures spent the rest of the time on small long/short. In summary, spot buying has begun to appear! Although the volume is not large, if it can take over the supply of futures stop-profit selling, the price can stand firm at 69,000;
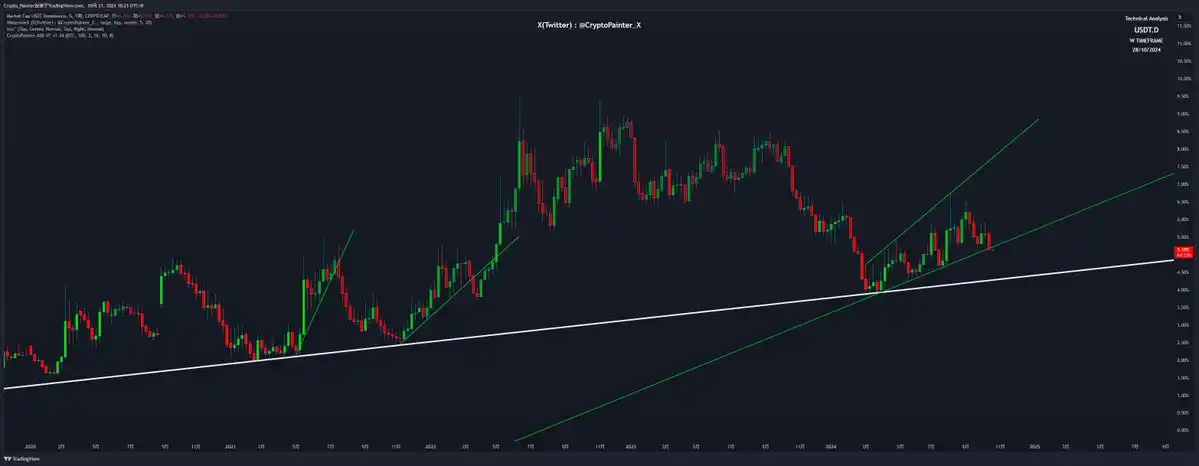
From the perspective of USDT market share, the weekly USDT market share has slightly fallen below the upward trend line of the past six months. If this is a confirmed break, it represents the entry of idle funds. The more likely performance is that BTC dominance has temporarily peaked, and copycat and small-cap projects will gain full liquidity in the next 2-3 weeks.
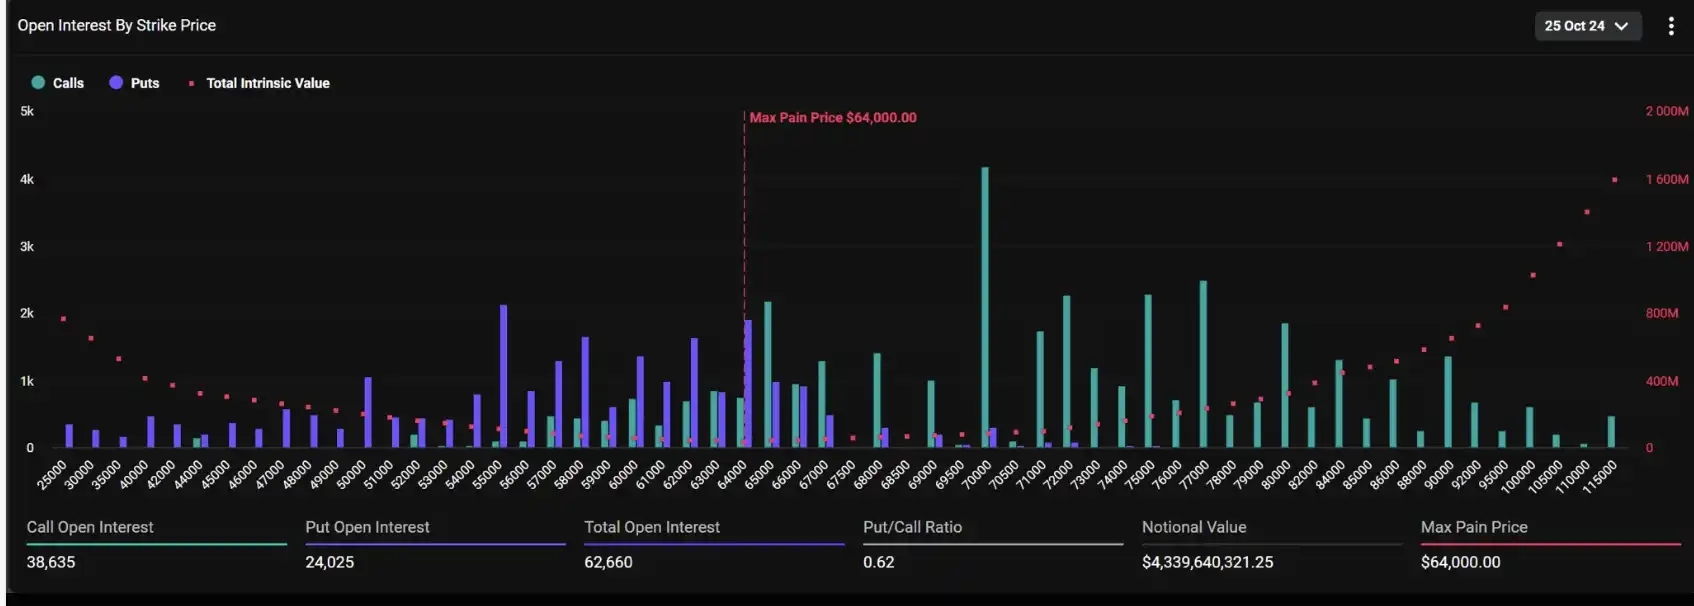
From the perspective of total futures positions, the total BTC futures positions have been at the 40 billion US dollar mark for three consecutive days. While the positions remain high, the price has risen by 1,500 US dollars, indicating that there is a small amount of spot funds entering the market; but compared with the previous BTC positions when it fluctuated between 68,000 and 69,000, the current total positions are 2.5 billion US dollars more. For spot bulls, although the mood is good, there has been no large-scale selling pressure. Therefore, for the current market, spot will not become a source of potential risks. The extra 2.5 billion positions may be the source of the next "long kill long" and the liquidation of a large number of high-level bulls. In a real bull market, every liquidation of a large number of leveraged bulls is a necessary condition for the next rise. In a market with high futures weight, shorts are the source of funds for the rise, and longs are all burdens.
Macro Analysis
@Phyrex_Ni
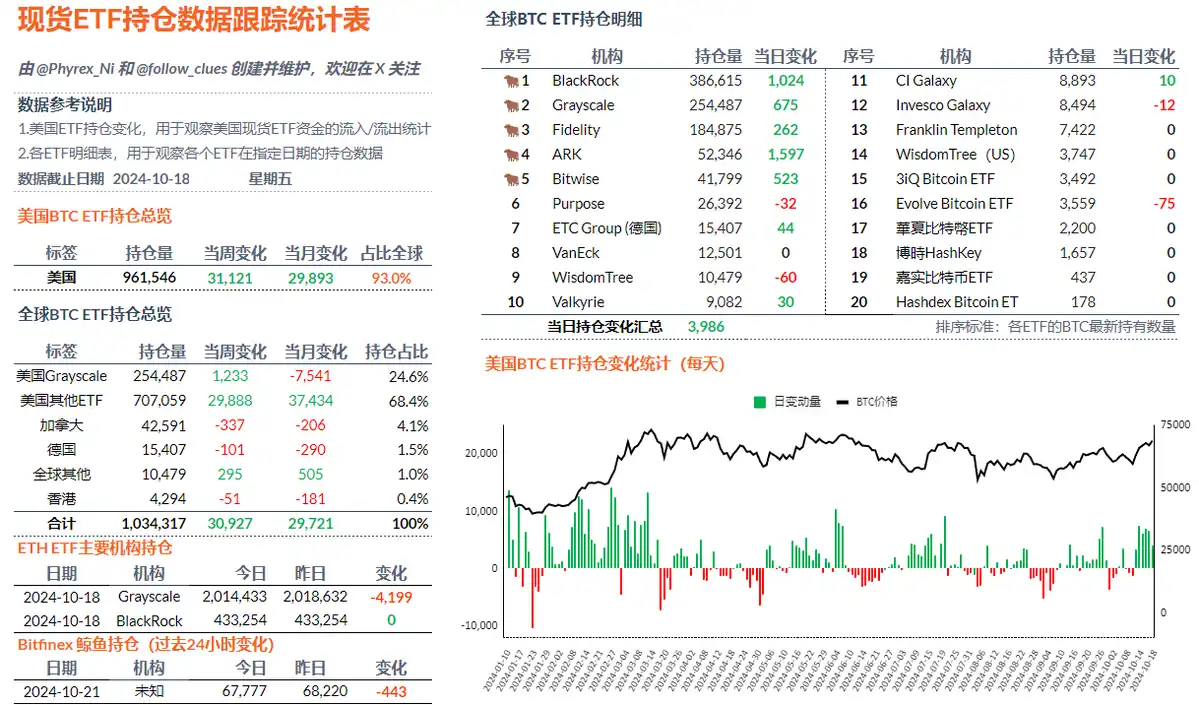
The data of BTC spot ETF last Friday still performed well. Although there is a trend of decreasing purchasing power like ETH, it can still be seen that a large amount of funds are concentrated in BTC. On Friday, the spot ETF had a net inflow of 4,099 BTC. Although it was the lowest data in the week, it was still much stronger than in the past.
BlackRock had net increases for five consecutive working days during the week, with a total increase of 16,975 #BTC. Such single-week increase data has hardly been seen since March. Fidelity ranked second with a net increase of 4,807 BTC, followed by ARK with 4,538 BTC and Bitwise with 2,244 BTC, ranking fourth.
It is worth mentioning that Grayscale's GBTC has increased its holdings by 963 BTC in the past week, not counting the number of Mini ETF holdings, which is in sharp contrast to ETH. Even when liquidity is very tight, investors' limited funds are still concentrated in BTC.
In the past week, the net purchasing power of the twelve US ETFs was 31,119.43 BTC, an increase of 685.34% compared with the previous week. This data is also far higher than ETH. Grayscale's net selling has turned from 1,103.36 BTC two weeks ago to a net inflow of 1,232.71 BTC. Grayscale is no longer synonymous with BTC selling.
Other Cryptocurrencies
@MaoShu_CN
The weekend’s cottage industry did improve, and Meme coins pulled back, but we still need to be vigilant under optimism. The oracle sector rose, and API3 and DIA mean that the activity on the chain has increased, which can be used as a signal of cottage optimism. APE rose after the release of pump in the morning of October 20, Eastern Time 8, with the highest increase exceeding 1 times, leading the rise of the metaverse and NFT sectors. Overall, the current narrative in the market does not seem to have hot spots related to the metaverse and NFT. We need to be cautious about these hot spots. It is possible that the copycats take the opportunity to be active and then ship. After all, in this round of cycle, the metaverse and NFT sectors are the least popular. We are still optimistic about the activity of the oracle sector. Last year, the copycats were also the first to set sail for the oracle sector. We hope that this time we can open up the activity of the market again.
@0XENAS
He believes that the market operates in a mysterious way. We all have the opportunity to find some currencies that may bring excess returns, or go to zero after being promoted by other KOLs. For him, he will choose $GOAT and $GNON, and he has already bought the bottom of GOAT. He believes that GOAT and GNON will become the key positions of the future long-term trend. If he is wrong, he will become the exit liquidity for others.
Welcome to join the official BlockBeats community:
Telegram Subscription Group: https://t.me/theblockbeats
Telegram Discussion Group: https://t.me/BlockBeats_App
Official Twitter Account: https://twitter.com/BlockBeatsAsia