Forum
Forum OPRR
OPRR Finance
 Specials
 On-chain Eco
 Entry
Entry
 Podcasts
 Data
Data

Week 9 On-Chain Data: Extreme Fear Sentiment, When Will the Sell-Off End?

 Summarized by AI
Original Article Title: "Intense Panic Sentiment, When Will This Selling Pressure End? | WTR 3.10"
Original Source: WTR Research Institute
Weekly Review
For the week from March 3rd to March 10th, the price of Sugar Futures reached a high near $94,416 and a low close to $79,177, with a volatility of around 16.14%.
Looking at the chip distribution chart, a significant amount of chips were traded around 78,557, providing some support or resistance.

• Analysis:
1. 1.61 million chips in the range of 60,000-68,000;
2. 2.24 million chips in the range of 90,000-100,000;
• There is a 60% probability that the short-term price will not fall below 75,000-79,000;
• There is a 60% probability that the short-term price will not rise above 92,000-87,000.
Important News
Economic News
1. US stocks experienced their worst week in six months, with the Nasdaq falling over 14% from recent highs.
2. Markets are betting that the Federal Reserve will cut interest rates by 25 basis points in June, July, and October.
3. The Federal Reserve will hold its interest rate meeting next Wednesday.
4. This Wednesday, inflation CPI data was released, with an expected value of 2.9% (previous value 3%), and core CPI expected at 3.2% (previous value 3.3%).
5. Gennadiy Goldberg, Chief Strategist at Credit Suisse, stated that the market has shifted from optimism to despair.
6. The US dollar experienced one of the largest monthly depreciations in the past 12 years.
7. The yield on the 2-year US Treasury bond fell significantly to 3.9% (10-year bond 4.2%), leading to steepening yield curve.
8. The US Treasury bond volatility (MOVE index) and corporate bond spreads are key risk indicators.
9. The latest US employment data shows signs of weakness, sparking debates about a soft landing and recession, leading to a significant downward revision of US economic growth forecasts for this year.
10. Trump's New Tariff Policy Causes Short-Term Market Sentiment Disruption.
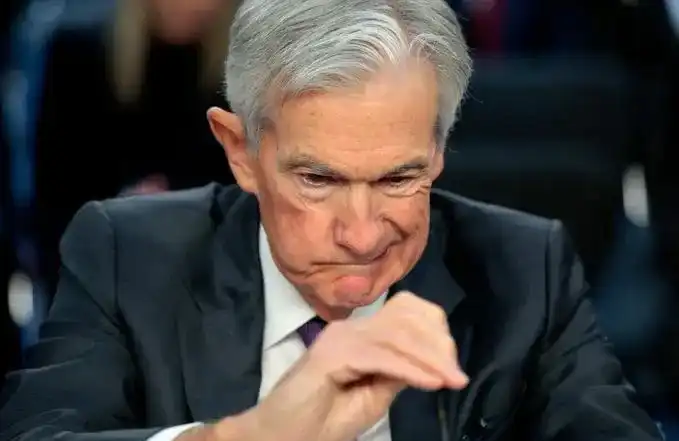
11. Powell Suggests That a Weak Jobs Market and Progress on Anti-Inflation Are Needed Before a Rate Cut, Warning of Trump's Potential Wrath if the Fed Reacts Slowly.
Crypto Ecosystem News:
1. The Texas Senate passed Bill No. 21 to establish a state-owned BTC reserve with a minimum holding of $500 billion in cryptocurrency.
2. The Japanese Cabinet approved amendments to cryptocurrency brokerage and stablecoin regulations, revising the "Payment Services Act."
3. Blockstream CEO Adam Back comments on the significance of the U.S. strategic BTC reserve announcement.
Market Sentiment and Indicators:
1. On March 10, the cryptocurrency Fear and Greed Index dropped to 20, indicating extreme market fear.
2. Last week, the U.S. BTC spot ETF saw outflows of $739.2 million, and the ETH spot ETF saw outflows of $93.9 million.
Institutional Developments:
1. Spanish banking giant BBVA to offer BTC and ETH trading and custody services in Spain.
2. Trump Family's WLFI Investment Portfolio Loses $110 million, with $80.85 million losses in ETH.
3. MicroStrategy Plans to Issue Preferred Stock to Raise $2.1 Billion for Potential BTC Purchase.
4. Global major banks and fintech companies are eager to launch their own stablecoins.
Data:
1. Santiment Data: BTC Whale and Shark addresses engaged in mild sell-offs from mid-February to early March, with addresses holding over 10 BTC collectively buying back nearly 5,000 BTC after March 3.
2. Since January 1 this year, approximately $10.46 billion worth of BTC and $1.74 billion worth of ETH have been withdrawn from various platforms.
Analyst Insights:
1. Grayscale Research Director Zach Pandl expects BTC to start serving as a store of value this year.
2. Analyst Jamie Coutts states that a weakening dollar could drive BTC strength.
3. MicroStrategy founder Michael Saylor suggests the U.S. reserve BTC total supply should be 5%-25%.
Long-term Insight: Used to observe our long-term situation; bull market/bear market/structural changes/neutral state Mid-term Exploration: Used to analyze what stage we are currently in, how long it will last, and what we will face
Short-term Observation: Used to analyze short-term market conditions; as well as the possibility of certain events occurring in a certain direction and under certain premises
Long-term Insight
• Illiquid Whale Group
• High Weight Sell-off
• ETF Fund Flows
• Exchange Whale Transfers
• On-chain Chips
• Short-term Speculators' Cost Line
(Below Illustration of Illiquid Whale Group)

This type of whale group has not undergone significant changes and usually determines the market's major trends.
Although the current market has caused significant volatility and intense panic sentiment, they have not shown any selling willingness.
(Below Illustration of High Weight Sell-off)

The high weight sell-off indicates that the market has entered a period of low sell-offs, which is generally rare. This period is seldom seen and occurs typically in large fluctuations and bull markets. It usually takes about half a year to a year for it to occur.
(Below Illustration of ETF Fund Flows)

ETF experienced a significant outflow and capital flight recently. Now, looking ahead, the capital outflow demand is slowing down, showing initial signs of tentative buying.
(See chart below for Large Transaction on Trading Platform)

The large transaction on the trading platform indicates that large participants are still relatively cautious. However, alongside this caution, there is now a slow emergence of initial buying demand. This means that the current price level is somewhat attractive to them.
(See chart below for On-chain Chips)

The market is closely monitoring the chips between 80,000 and 76,000.
So much so that a large number of chips have been accumulated in a short period. It seems that the current position also holds considerable appeal.
(See chart below for Short-term Speculator Cost Line)

The short-term speculator cost is around 91,500-92,000.
This range is crucial; if the market cannot quickly return to the prices above, it may face the pressure of short-term speculators unwinding their positions and the selling pressure from profit-taking activities.
Currently, the market sentiment seems rather subdued.
Medium-Term Exploration
• Illiquidity supply
• Supply held by short-term and long-term participants
• Stablecoin supply
• Liquidity supply
• Network sentiment positivity
This week focuses on the supply across various dimensions, delving into the exploration of medium-term liquidity and sentiment effects.
(See chart below for Illiquidity Supply)

The illiquidity supply belongs to a group of accumulating addresses with low liquidity status, serving as a dynamic deflationary indicator of compressed surface available for sale supply.
Currently, BTC's volatility is low, partly because the overall coin volume of non-moving addresses, i.e., those hoarding coins, is also increasing.
The data also reveals BTC's fundamentals, with the holding group's coin amount continuously increasing as they choose to keep funds within the ecosystem.
(See chart below for short-term and long-term holder supply)

Currently, there is a downward trend in short-term supply, while relative long-term supply shows a slight upward trend.
Short-term liquidity might be lacking, leading to an increase in on-chain long-term holdings. This trend has persisted since 2018.
(See chart below for stablecoin supply)

The growth rate of stablecoin supply is also declining, possibly slowing down the inflow of capital into the market.
(See chart below for liquidity supply)

There are signs of a slight decrease in liquidity, indicating that the market may still be in a phase of adjustment and recovery.
(See chart below for network sentiment positivity)

The growth rate of network sentiment is slowly decreasing, suggesting that market sentiment is still slowly recovering, and the near future may be a period of weak sentiment.
Short-term Observations:
• Derivative Risk Index
• Options Intentional Transaction Ratio
• Derivatives Trading Volume
• Options Implied Volatility
• Profit and Loss Transfer Amount
• New and Active Addresses
• BitMEX Exchange Net Flows
• Huobi Exchange Net Flows
• High-Weighted Sell Pressure
• Global Buying Power Status
• Stablecoin Exchange Net Flows
• Layer-2 Exchange Platform Data
Derivatives Rating: The Risk Index is in the green zone, indicating a reduction in derivative risk.
(See chart below for Derivative Risk Index)

After a series of long liquidations, the funding rate has entered the green zone, indicating a higher probability of short liquidations this week.
(See Option Intent Open Interest Ratio below)

The put/call ratio has slightly increased but remains low, with trading volume at a moderate level.
(See Derivatives Trading Volume below)

The derivatives trading volume is at a low level.
(See Option Implied Volatility below)

The option implied volatility has shown rapid fluctuations in the short term.
Sentiment Status Rating: The market's fear sentiment is at a relatively low level.
(See Profit/Loss Transfer Quantity below)

The following analysis is specific to BTC. Despite the current lower price, the fear sentiment has not escalated significantly. With a continued lack of buying pressure in the market, the expectation leans more towards consolidation and pullback.
(See New Address and Active Address below)

New and active addresses are both in a declining trend, indicating overall market activity is at a low level.
Spot Market and Selling Pressure Structure Rating: BTC is experiencing an outflow accumulation, while ETH has seen significant outflows.
(See Bexar Transaction Platform Net Position below)

BTC is in an outflow accumulation state.
(See E-Sun Transaction Platform Net Position below)

A large amount of ETH has flowed out.
(See chart for heavy sell pressure)

The current drop has not seen much participation from heavy sell pressure.
Buy Pressure Rating: Global buy pressure is in a weakening state, with stablecoin buy pressure experiencing a slight decrease.
(See chart for global buy pressure status)

Current buy pressure is in a weakening state.
(See chart for USDT exchange net flows)

Stablecoin buy pressure has experienced a slight decrease.
Off-chain Transaction Data Rating:
There is buying interest at 75000; there is selling interest at 90000.
(See chart for Coinbase off-chain data)

There is buying interest around 70000-80000 price levels;
There is selling interest around 90000 price level.
(See chart for Binance off-chain data)

There is buying interest around 70000-80000 price levels;
(See chart for Bitfinex off-chain data)

There is buying interest around 75000 price level;
Weekly Summary:

Message Summary:
1. Cryptocurrency, like the Nasdaq index, currently belongs to the interest rate-sensitive risk assets category;
2. Recently, cryptocurrency continues to primarily trade in sync with risk assets, so the cryptocurrency market is closely related to the Fed's interest rate cut expectations.
Historical experience shows that the capital market often exhibits increased uncertainty, elevated risk premium, and tightening of funding during a period of balance sheet reduction.
However, after the cessation of balance sheet reduction, as policy signals become clearer, market expectations gradually improve, liquidity is released, thus often triggering a temporary rebound.
Using the experience from the period after the 2008 financial crisis until 2014 as an example, the Fed adopted a large-scale unconventional monetary policy post-crisis, and the market reacted strongly to balance sheet reduction expectations during the "Taper Tantrum" period, leading to short-term phenomena such as funding constraints, rising bond yields, and increased market volatility.
However, it is precisely after the balance sheet reduction stops or shifts to an expansionary phase that market sentiment rapidly improves. This also reflects that markets often digest policy information in advance of formal announcements, and the extent and timing of the rally depend on fundamental data, global macro environment, and the clarity of policy communication.
Currently, the U.S. government faces not only short-term funding difficulties but also long-term fiscal sustainability challenges.
Latest data shows that the U.S. federal budget deficit for the 2025 fiscal year is expected to reach $1.9 trillion and is projected to further rise to $2.7 trillion by 2035.
This highlights the severe challenges the U.S. faces in fiscal policy over the next decade. House Republicans introduced a bill on March 9 for a vote in the near future to address the upcoming funding crisis. However, these short-term "life-saving" measures do not fundamentally address America's increasingly serious fiscal issues.
Generally, to avoid government debt financing obstacles and market liquidity shortages, the Fed sometimes has to adjust its strategy, transitioning from the previous tightening policy (balance sheet reduction) to halting balance sheet reduction gradually, and even further implementing expansionary policies.
Through large-scale government bond purchases, not only is continuous market demand provided, but it also lowers the bond yields, thereby reducing refinancing difficulties to maintain fiscal stability.
This measure is similar to when an investor chooses to increase investment rather than withdraw from a company when the company is facing a crisis, to prevent the company from falling into trouble due to a broken capital chain.
At the same time, if unfavorable conditions such as economic downturn or credit tightening occur in the future, the market expects that the policy direction may gradually shift from balance sheet reduction to expansion (currently, there are not many signs of expansion), coupled with rate cut expectations in June or July, and possibly more than two rate cuts within the year.
Thus, in the short to medium term, this could still drive an initial market rebound effect. Subsequently, if liquidity improves further, it will continue to guide the upward movement of capital markets, crypto markets, corporate bonds, and other risk-on assets.
The market may currently be going through a process of transitioning from a tightening phase to a policy shift to a loosening cycle (at least halting the anxiety-inducing balance sheet reduction).
As policy signals are sequentially transmitted and gradually implemented, the market will digest this change over the next few months to half a year, further supporting risk assets, at the very least preventing a deep bear market and even becoming favorable conditions for supporting an upward trend.
Key Points to Watch:
Inflation, labor force, overall economy, and the Fed's rhetoric.
On-chain Long-term Insights:
1. The illiquid whale group currently shows no significant changes, relatively holding more;
2. High-weighted sell-offs indicate the market entering a period of low sell-offs;
3. Cryptocurrency ETF outflows are slowing down, showing initial signs of tentative purchases;
4. Large transfers on exchanges indicate whales are relatively cautious, but they also show no willingness to sell;
5. The market is heavily focused on chips between 80,000 and 76,000;
6. The cost for short-term speculators is around 91,500-92,000, which is a resistance range.
• Market Sentiment:
The market has returned to a relatively healthy state internally, and currently, attention is needed on stabilizing external sentiment.
On-chain Mid-term Exploration:
1. The accumulation effect of hodling coins is still ongoing;
2. Slightly limited short-term liquidity;
3. Slowing down of incremental entry speed;
4. Slight decrease in liquidity;
5. Network sentiment growth rate is declining.
• Market Sentiment:
On-chain activity is lackluster, which may need to gradually stabilize and recover.
On-chain Short-term Observations:
1. The risk index is in the green zone, reducing derivative risk.
2. The number of new active addresses is relatively low, indicating low market activity.
3. Market sentiment rating: The level of panic sentiment is relatively low.
4. Exchange net flows show BTC in an overall outflow state, with significant outflows of ETH.
5. Global buying power is decreasing, with a slight decrease in stablecoin buying power.
6. Off-chain transaction data indicates buying interest at 75,000 and selling interest at 90,000.
• Market Sentiment:
Short-term market panic sentiment has not continued to rise and spread. However, with a lack of buying power and positive news, the market is expected to remain in a state of fluctuation and derivative liquidation, with few trading opportunities.
Risk Warning:
The above is all market discussion and exploration and does not constitute investment advice. Please treat with caution and be prepared for market black swan risks.
This article is a contribution and does not represent the views of BlockBeats.
Welcome to join the official BlockBeats community:
Telegram Subscription Group: https://t.me/theblockbeats
Telegram Discussion Group: https://t.me/BlockBeats_App
Official Twitter Account: https://twitter.com/BlockBeatsAsia