Forum
Forum OPRR
OPRR Finance
 Specials
 On-chain Eco
 Entry
Entry
 Podcasts
 Data
Data

Bitcoin Revisits $80,000, What Are the Key Support and Resistance Levels?

 Summarized by AI
Original Article Title: "Market Plunge, Bitcoin Once Again Tests $80K, Is the Bear Market Coming?"
Original Article Author: Luke, Mars Finance
Introduction
The cryptocurrency market is currently in a state of turmoil. Yesterday, on March 9, Bitcoin—the guiding star of the crypto world—plunged by 7%, retracing from its high, triggering widespread panic in the market. According to The Block data, the spot market trading volume on centralized exchanges (CEX) in February reached $1.77 trillion, hitting a new low for the year and declining by 23.7% from January's $2.32 trillion, indicating a significant contraction in market activity. Meanwhile, crypto analyst Miles Deutscher pointed out on social media that in the past 90 days, only 12 out of the top 100 cryptocurrencies by market capitalization have seen positive returns. For example, BERA surged by 579.63%, TRUMP rose by 85.61%, while Bitcoin plummeted by 13.47% and LINK suffered a massive 40% drop. This sharp divergence alongside the decline in trading volume paints a picture of extreme market panic. So, does this mean the bear market has quietly arrived?
Market Sentiment and Fear Index
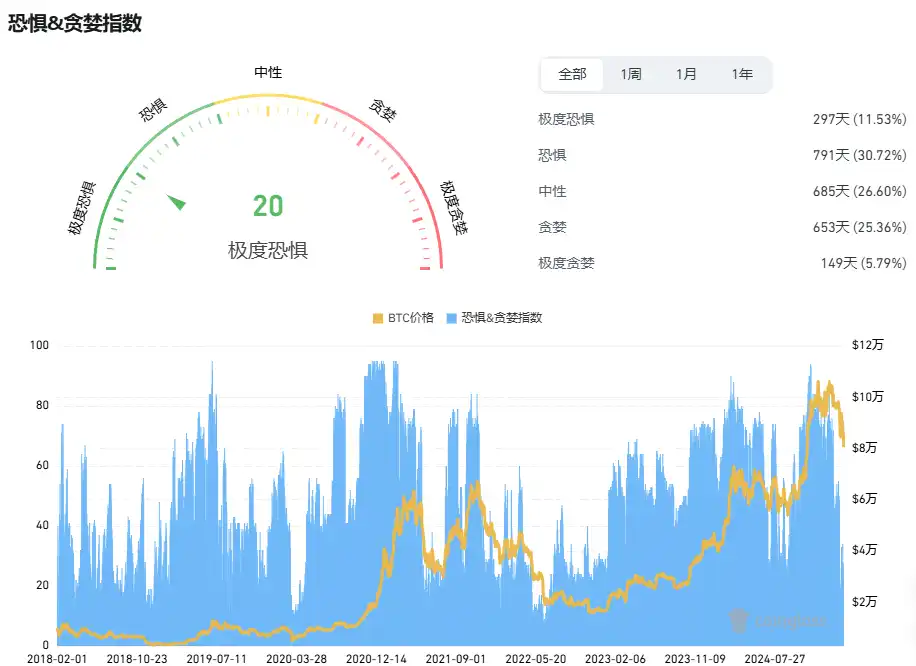
Market sentiment is one of the key indicators for trend analysis, and liquidation data, as a direct reflection of market sentiment, provides vital supplementary information for this analysis. Currently, the Cryptocurrency Fear and Greed Index has dropped to 35, indicating "fear," a significant drop from the "extreme greed" level of 70 a month ago, reflecting a rapid deterioration in investor confidence. Glassnode's Net Unrealized Profit/Loss (NUPL) indicator further confirms this trend, dropping from 0.6 (high greed) to 0.2, approaching levels seen at the beginning of historical bear markets. Usually, levels below 0 indicate the market entering a capitulation phase, and the current value suggests that while the market has not completely collapsed yet, the panic sentiment is approaching a critical point.
CryptoQuant data shows that the demand growth in the Bitcoin spot market is slowing down, and the proportion of short positions in the futures market's open interest has significantly increased. As of March 9, short positions in CME Bitcoin futures accounted for 45% of the total open interest, rising by 15 percentage points from the 30% in early February. This dominance of short positions has intensified market panic sentiment, with investors enhancing their expectations for price declines, and some even discussing whether Bitcoin will break below the psychological barrier of $60,000.
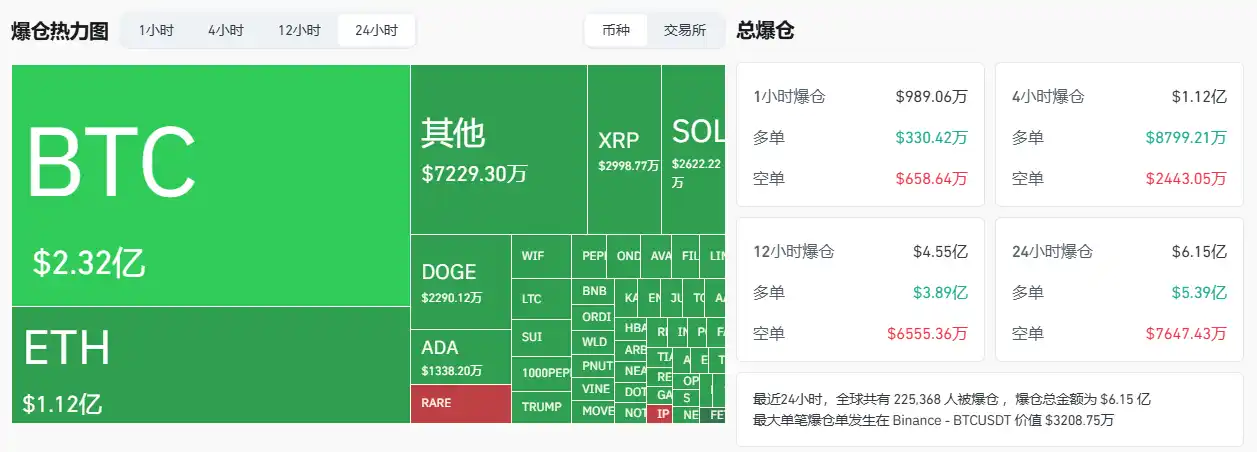
Liquidation data further reveals market dynamics, with BTC liquidated amount reaching $4.7072 million and ETH $1.3061 million in the past 1 hour, totaling $11.5482 million. Long liquidations amounted to $8.2925 million, while short liquidations reached $24.3301 million, indicating a significant imbalance favoring shorts which could lead to a short squeeze and a short-term bounce. Over the past 24 hours, total liquidations hit $616 million, with longs liquidated at $540 million and shorts at $76.3075 million, showcasing prolonged bearish pressure. This aligns with the worsening NUPL and rising short positions, indicating both short-term volatility and long-term risk. Investors need to be cautious of this complexity, focus on short squeeze opportunities, and guard against downside risks in a bear market.
Technical Analysis: Key Support and Resistance Levels
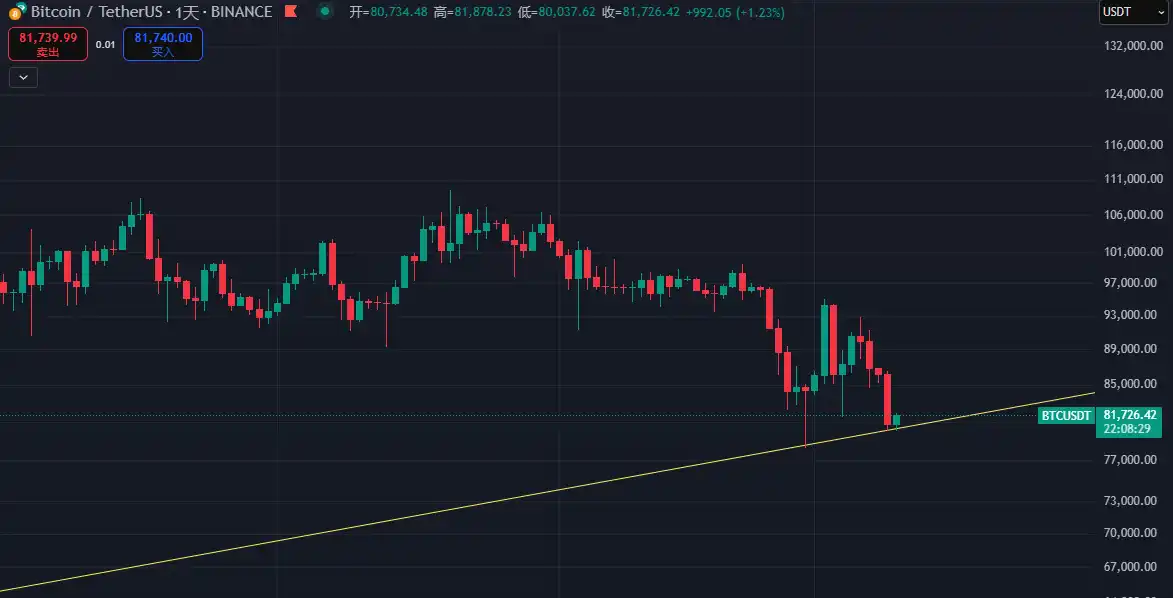
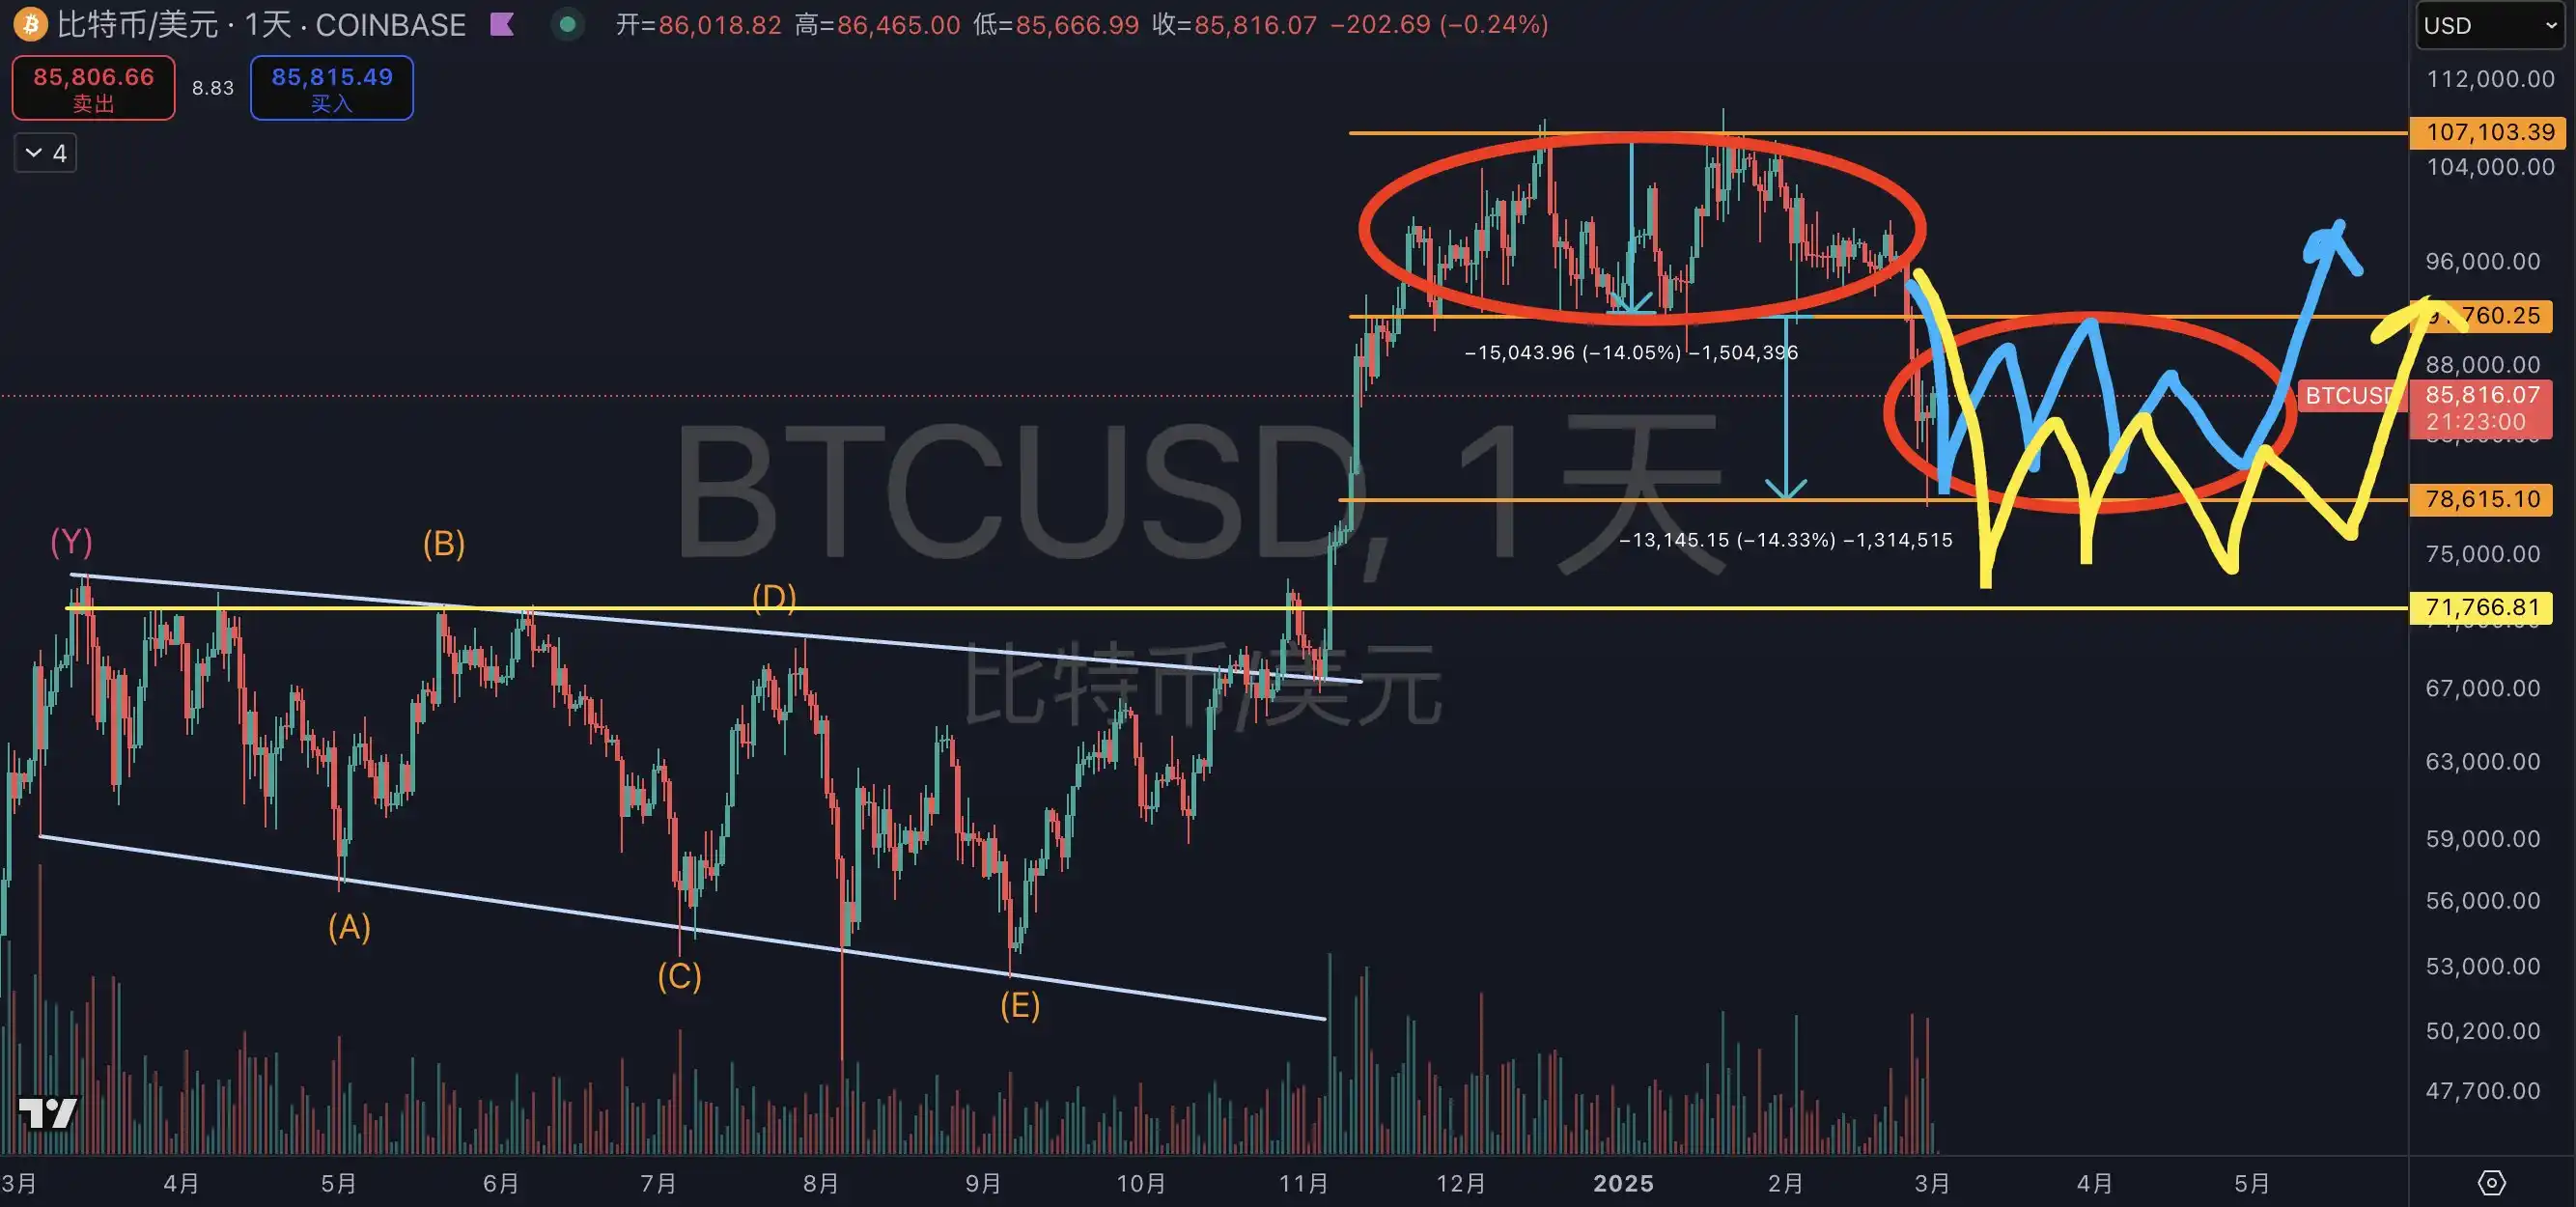
From a technical perspective, the Bitcoin price is at a critical juncture. Following the consolidation from November 20, 2024, to February 24, 2025, after reaching a high, the price has formed a potential double top pattern—a typical bearish signal. After breaking below the double top neckline, the price dropped from a high of $82,000 to around $76,000, with a nearly achieved target range of approximately 10%. However, the time aspect of this move has not been fully absorbed.
Analysts generally believe the market may face two scenarios:
· Scenario 1: Time for Space If $78,000 holds as the bottom, both bulls and bears need to patiently wait for two to three months to confirm the trend. Currently, the range between the 50-day moving average (around $77,500) and the 200-day moving average (around $72,000) has become a short-term battleground. If the price can hold above $78,000, it may form a W-bottom pattern, laying the foundation for a subsequent rebound.
· Scenario 2: Further Downside If bearish momentum prevails, the price might decline to the high liquidity area of $70,000-$72,000. This region not only serves as the support of the 200-day moving average but also marks a significant retracement level after the rebound from the low point in August 2024. Trader Eugene Ng Ah Sio stated in a Telegram group, "I'm not eager to engage in spot trading at the current price; $75,000 is the only level that interests me." This cautious approach reflects market uncertainty.
Additionally, the Relative Strength Index (RSI) is currently at 42, dropping from overbought territory (above 70) to a neutral to slightly oversold level, suggesting a relief in short-term selling pressure but not yet entering oversold territory (below 30). Technical analysis advises investors to stay on the sidelines, avoid chasing the market blindly, and wait for a clearer trend.
Macroeconomic Background: Diminished Bullish Factors and Uncertainty
The impact of macroeconomic factors on the cryptocurrency market cannot be ignored. Firstly, changes in the global interest rate environment are putting pressure on high-risk assets. The US 10-year Treasury yield recently rose to 4.2%, up 40 basis points from the beginning of the year at 3.8%, attracting funds flowing back from the crypto market to traditional safe-haven assets. At the same time, persistent inflation expectations and the possibility of the Federal Reserve delaying rate cuts further diminish the attractiveness of Bitcoin as "digital gold."
On the legislative front, the weakening of bullish news has also exacerbated market pressure. Taking the example of the Bitcoin bill in Utah, the bill was passed in the state Senate on March 7 with 19 votes in favor and 7 against, and is set to be signed into law by the governor. However, its core provision—allowing the state of Utah to hold Bitcoin as a reserve asset—was removed in the final deliberation. The original provision would have authorized the state treasurer to invest in Bitcoin, with a cap of 5% of its market cap (approximately $25 billion), potentially making Utah the first state in the US to hold Bitcoin reserves. Now, the bill only retains provisions for custodial protection and basic rights related to Bitcoin mining and node operation, greatly diminishing its impact.
The exhaustion of macroeconomic bullish factors has shaken market confidence, while external uncertainties (such as the potential adjustment of crypto policies by the Trump administration) are adding to the market's unpredictability. Bloomberg analysts predict that if Trump is reelected, his tax cuts and deregulation policies could provide a short-term boost to the crypto market, but the long-term effects remain to be seen.
ETF Outflows: Decline in Institutional Enthusiasm

Institutional demand was a key driver of the Bitcoin price surge in 2024, but recent outflows from spot ETFs are a cause for concern. According to data from sosovalue, since March, net outflows from US Bitcoin spot ETFs have exceeded $500 million, with Grayscale's GBTC outflows being particularly pronounced. Julio Moreno, Director of Research at CryptoQuant, pointed out: "Bitcoin spot demand growth is contracting, while the futures market is dominated by short positions, which directly leads to price declines."
Jacob King, Founder of WhaleWire, put it more bluntly: "The Bitcoin bear market is here. ETF outflows are at a record high, the institutional demand narrative is crumbling, and Bitcoin is heading towards multi-year lows." While this view is somewhat extreme, the outflows from ETFs do reflect a decline in institutional enthusiasm. At the beginning of 2024, daily average net inflows into ETFs reached as high as $200 million, but now they have turned into net outflows, indicating that institutional investors are reevaluating the risk-return profile of crypto assets. This shift has dealt a further blow to market confidence.
On-Chain Data: Coexistence of Hope and Uncertainty
On-chain data provides the market with a ray of hope. According to Glassnode's analysis, the behavior of long-term holders (investors holding for over a year) is undergoing a transition from a distribution phase to an accumulation phase. As of March 9, the net position change of long-term holders has turned positive, with a daily average inflow of around 5,000 bitcoins. Historically, this shift in trend has often been a reliable signal of the market transitioning from a top to a bottom, such as during the formative periods of the bottoms in early 2019 and March 2020.
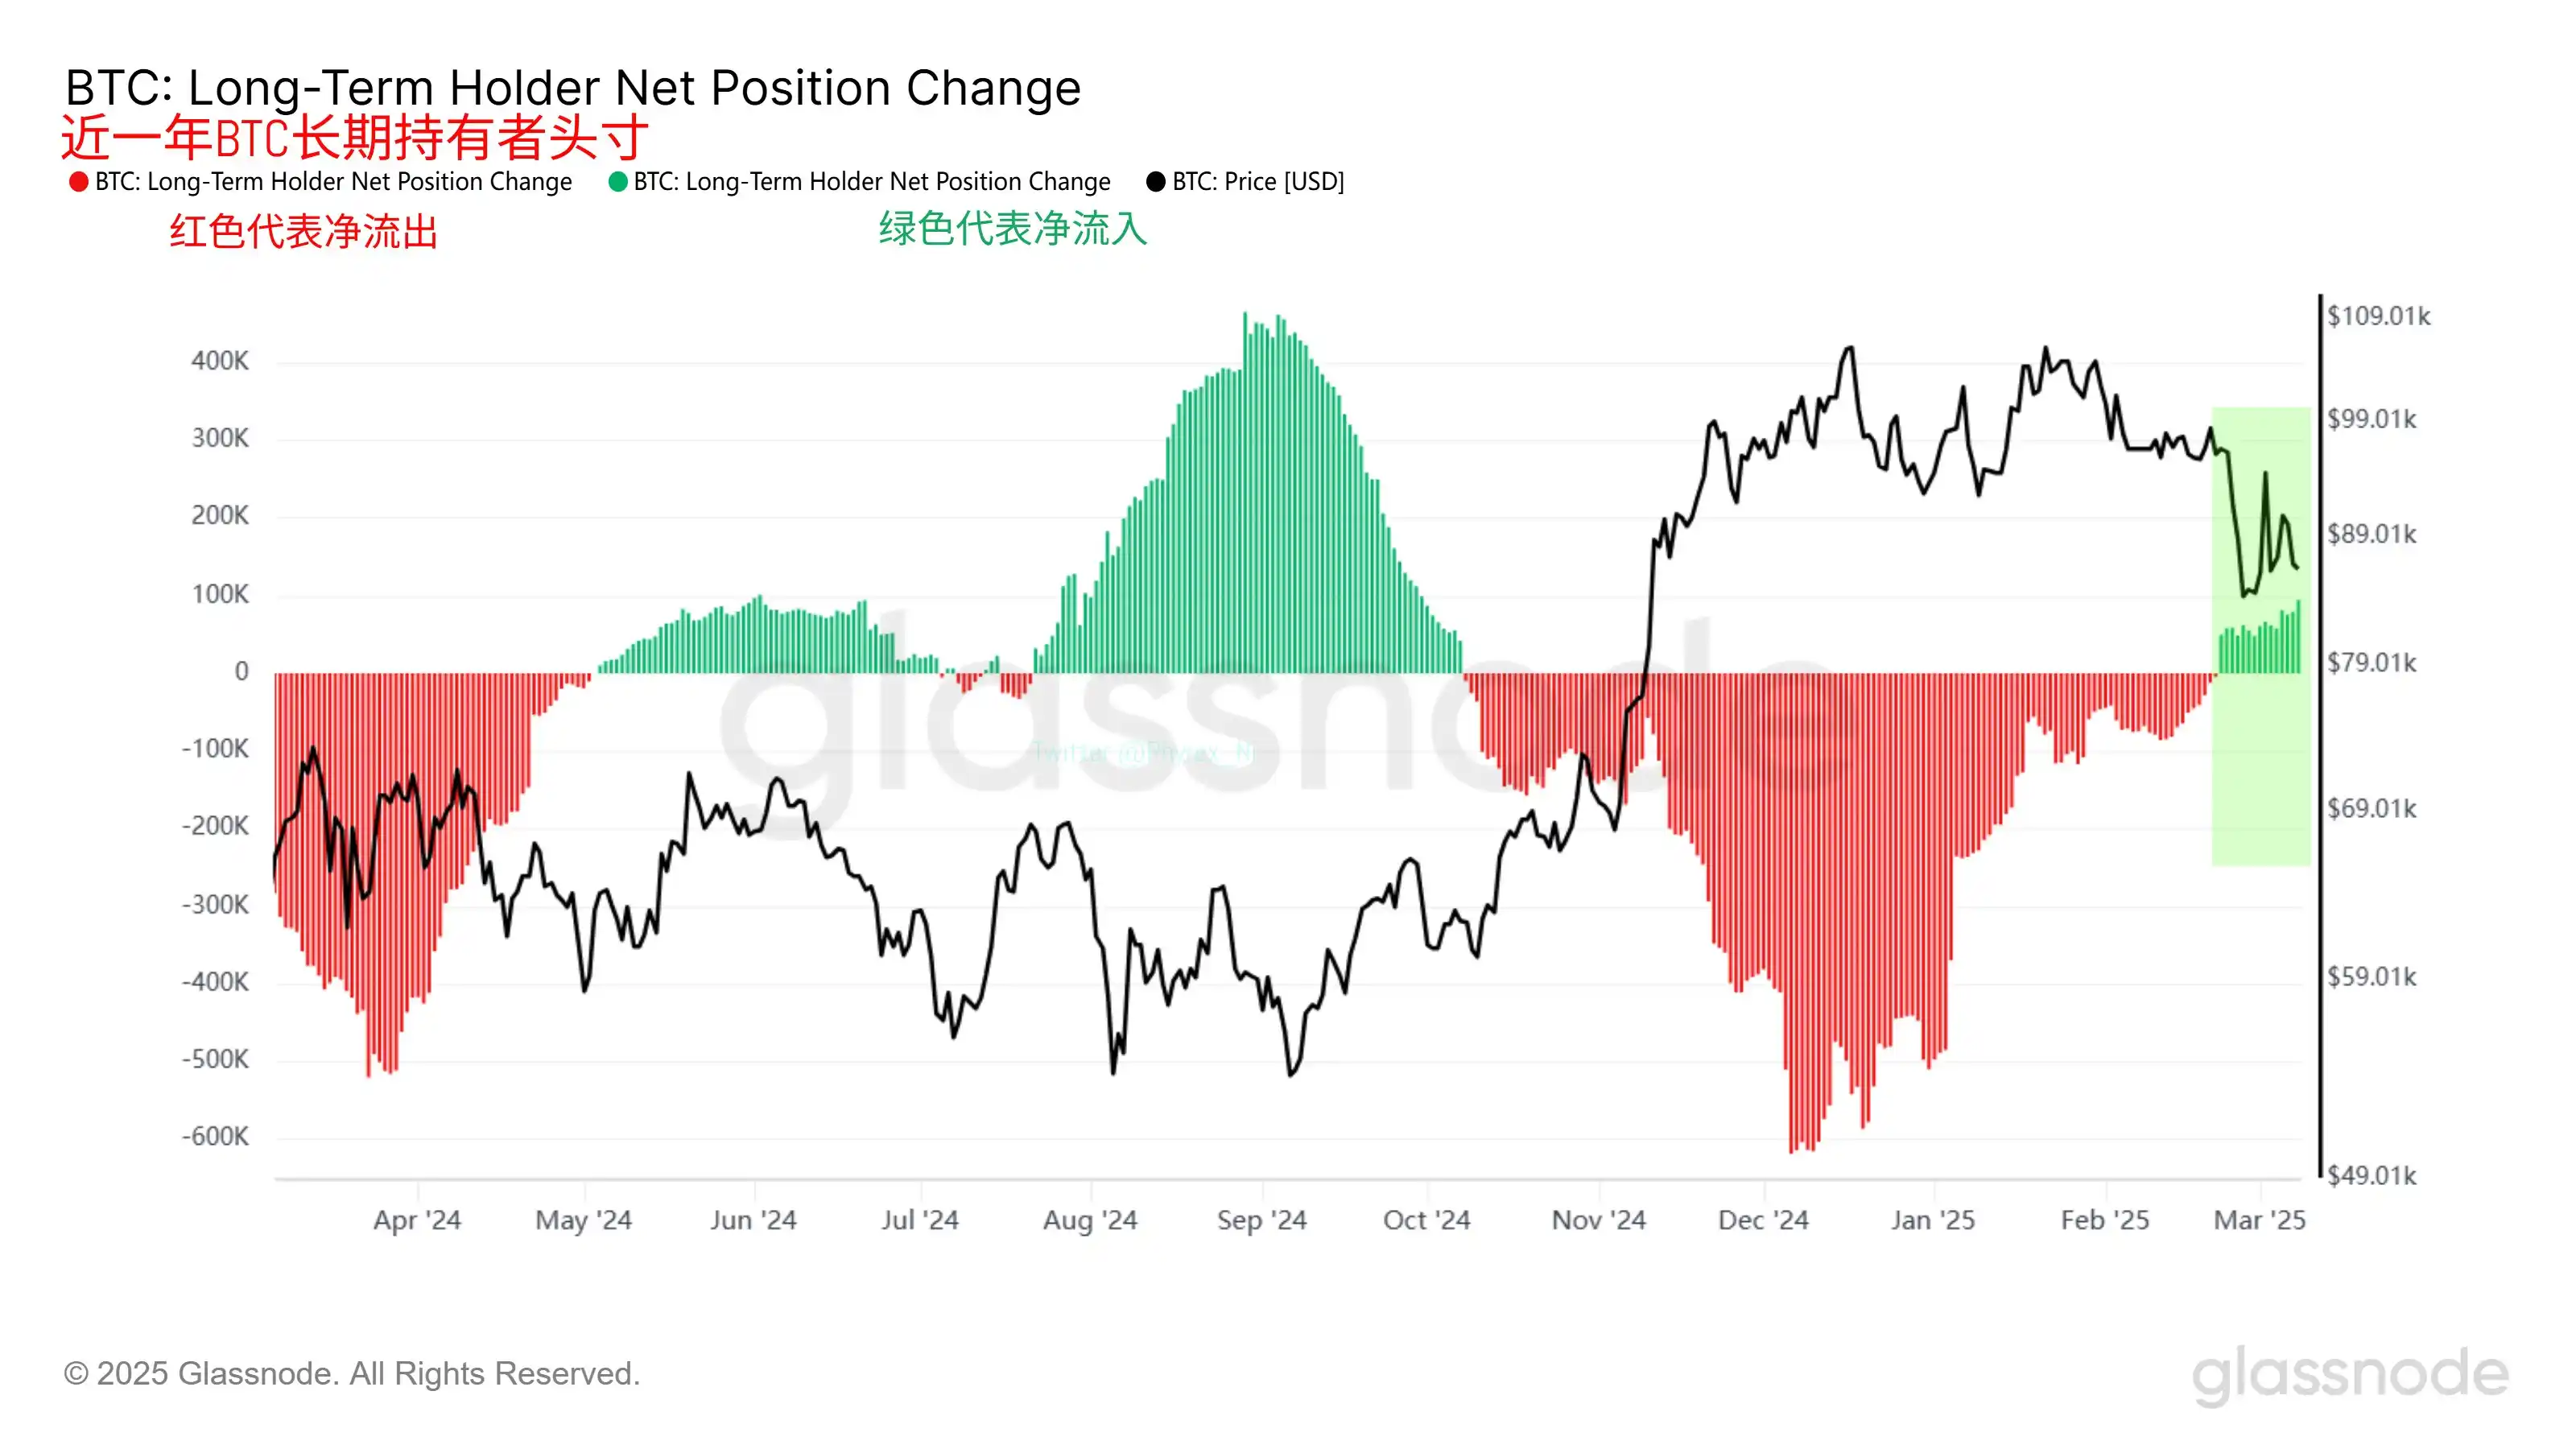
However, the current situation differs from past cycles. First, the price decline may be slow and sustained, only reaching a relative bottom when long-term holder holdings reach new highs (such as exceeding 700,000 coins). Second, the rise of spot ETFs has altered the holder composition. Arkham Intelligence data shows that ETF holders currently control around 4% of bitcoin's circulating supply (about 840,000 coins), while the proportion of traditional on-chain long-term holders has decreased from 65% in 2023 to 60%. This shift may weaken the predictive power of traditional on-chain metrics.
While the shift of long-term holders to a buying mode is encouraging, it is still in the early stages of inflow, and the possibility of a reversal has not been ruled out. Market bottom predictions still need to be validated with more external signals.
Historical Comparison: Similarities and Differences in Bear Markets
Looking back at history, the current market shares similarities with the bear markets of 2018 and 2022 but also exhibits significant differences. In 2018, bitcoin plummeted from $20,000 to $3,200, a drop of over 80%, accompanied by the bursting of the ICO bubble and a decline in trading volume; in 2022, it fell from $69,000 to $16,000, a drop of about 76%, impacted by the FTX collapse and rate hikes. However, the current decline of bitcoin from its high of $82,000 is around 7%-13%, far from the levels seen in historical bear markets.
Similarities lie in the decrease in trading volume and market segmentation. For instance, in 2018, CEX trading volumes dropped by 70% from their peak, while currently, it has only decreased by 23.7%. The difference lies in institutional participation and the emergence of ETFs, providing the market with a new cushioning mechanism. Therefore, the current panic may be a period of adjustment rather than a full-fledged bear market. But if ETF outflows continue to expand, a historical tragedy may replay.
Whether the market has entered a bear market is still inconclusive. Technically, the risk of a pullback remains, with key support levels like $78,000 and $75,000 being tested; macroscopically, limited positive news, exacerbated ETF outflows, and a weakening institutional narrative are observed; while on-chain data hints at increasing confidence from long-term holders, the bottom is still unclear. The current panic may be a harbinger of a deeper adjustment or a period of darkness before the dawn.
For investors, caution is key. As Miles Deutscher puts it: "This is a rotational market, where holders are being punished." Instead of chasing short-term price swings, it's better to focus on the intersection of technical support, macro trends, and on-chain signals. Drawing wisdom from Warren Buffett— "Be greedy when others are fearful and fearful when others are greedy"—in the turbulent waves of the crypto market, risk management and a long-term perspective are the way to survival.
Welcome to join the official BlockBeats community:
Telegram Subscription Group: https://t.me/theblockbeats
Telegram Discussion Group: https://t.me/BlockBeats_App
Official Twitter Account: https://twitter.com/BlockBeatsAsia