 Forum
Forum OPRR
OPRR Finance
 Specials
 On-chain Eco
 Entry
Entry
 Podcasts
 Data
Data

Daily Chart: Three "Doji Stars" Signal Big Volatility Ahead? | Trader's Insight

 Summarized by AI
The Bitcoin market price experienced a setback amidst multiple bearish factors and market dynamics, displaying a characteristic of "rapid rise and fall, long versus short tug-of-war." The price fluctuated from a high of $99,168 on February 6 to a low of $95,320 on February 10, with several attempts to break through the psychological barrier of $100,000 proving unsuccessful. Despite briefly showing bullish signals such as "breakout of the Bollinger Band upper rail" and "Fibonacci extension target of $166,000," the market sentiment shifted from an "eternal bull market" to a "cautious wait-and-see" stance due to the Trump administration's policy uncertainties (repeated tariff threats against Mexico and Canada, the fictitious nature of the cryptocurrency committee) along with a cooled expectation of a Fed rate cut.
Notably, on February 7, Bitcoin briefly surged to $100,154, but subsequently experienced a panic sell-off triggered by rumors of the Ethereum Foundation's sell-off and the U.S. Department of Justice's plan to liquidate $6.5 billion in seized bitcoins, causing the price to quickly drop back to the $95,000 range. Traders' opinions on the market diverged: some view the current situation as a "leverage cleanup and healthy pullback," with pins on the weekly K-line indicating main force accumulation and a returning green MACD column suggesting a rebound; while others are concerned that the "Trump effect" has been fully priced in by the market, the technical flag correction may turn into a "bull trap," and there may be a short-term test of the $90,000 support level. The rumor of the Trump family fund's exit and ETH has further eroded trust in the policy narrative, with some investors jesting, "The myth of getting rich quick and the roar of thunder, surprisingly, are the two hands of the same government."
Analyst DOM identified an unprecedented "Doji Star" pattern on Bitcoin's daily chart, which typically signals market uncertainty, similar to the trend after the FTX crash in November 2022. DOM stated, "In Bitcoin's 15-year history, we have seen for the first time three consecutive 'extreme Doji Stars' candlestick patterns, with each candle's body accounting for less than 0.05% of the total candle range. This indicates extreme market indecision, signaling an upcoming significant fluctuation." How do traders view this? Let's take a look at the traders' opinions in the market.

Technical Analysis
@Crypto_Laowai
Key Short-Term BTC Levels. Pressured by the yellow trendline. 4-hour resistance at 98,120, break above to see 102-103k. Pressured pullback targets 93,600 to capture liquidity. But whether going up directly or after a drop, hitting around 102-103k in the near term is highly probable.

@Patrade_Buer
BTC's trend view remains unchanged: Weekly oscillation (signifying consolidation before further upside);
Daily downtrend, currently in a bearish trend, dominated by bears. There is a probability of upward liquidity grab on the hourly timeframe, with current liquidity and EQH liquidity being formed above. The bias currently leans towards seeking liquidity on the upside. Targets above need some scrutiny, $99,700, $102,000 H4 bearish view at $106,000. Here, contracts need to see if they can provide a pullback down to get around $96,500 where FVG liquidity is, for better buy opportunities after absorbing in the bearish market.

@Murphy_Chen
Historically, after a weekly chart forms a death cross at a high, the subsequent rebound is roughly 15%-20%. If calculated based on the current $97,000, a maximum 20% rebound would be around $116,400.
Coincidentally, this falls just above the orange line, below the red line.

Based on my previous article on observing a trend's pricing range using the Extreme Deviation Band, this might be the extreme rebound position of this round of the trend.
In simple terms, within the context of "trend attenuation," there will be a rebound, but it may not necessarily reach the extreme position. I wonder if this is a coincidence, an interplay between on-chain data and candlestick technicals.
Macro Analysis
@Maoshu_CN
February 10 Data Recording Comparison: Funds flowed slightly out of Asia and Europe, while funds continued to flow into the US region, and market activity gradually recovered.
Market heat gradually picked up on Monday, with market capitalization slightly increasing. The share of altcoins increased slightly, while the BTC share weakened slightly. ETH also continued to weaken, with its share following suit.
In terms of trading volume, compared to the previous Saturday, there was still a slight decline. Monday in the Asia-Europe market was quiet, only waiting for the official opening of the US region tonight to activate the market.
Funds continue to flow into the market, with on-exchange funds increasing by another $1.1 billion, bringing the current total to $232.8 billion.
USDT: Official website data shows $141.618 billion. Compared to the previous Saturday, there was a slight outflow of funds from the Asia-Europe market. Fund activity increased, with some funds leaving after trading, indicating a temporary lack of confidence in the Asia-Europe market on Monday.
USDC: Data sources show a $209 million increase in funds, with increased activity. Funds continue to flow into the US region.

US stock market opening, led by tech stocks and large metal companies, pushed the market higher. The four major indices followed the pre-market trend, maintaining an upward trajectory!
Gold prices continued to rise, with a short-term drop in the 10-year US Treasury yield, leading to a rise in bond prices and a decrease in yields.
Similarly, following the same "theme" as last week—tariffs, the reactions and trends are indeed completely different. As we mentioned earlier today, the risk market is becoming "desensitized" to tariff issues, but risk liquidity is still greatly diverted. In the short term, gold, long bonds, and US stocks have diverted risk liquidity. As expected, the crypto market has experienced a short-term "fragmentation."
@Phyrex_Ni
The momentum of the US stock market is quite good after the opening, especially NVIDIA seems to have emerged from the shadow of DeepSeek, achieving a five-day uptrend while vigorously filling the downside gap.
Trump said that it has not yet helped AI and cryptocurrencies in terms of price, but this is ultimately a long-term matter. It is not something that will rise today if it falls tomorrow. It also requires the cooperation and support of various departments. Many states in the US have begun strategic reserve layouts thanks to this. Many policy adjustments have also benefited from this. Even the strategic reserve has not been truly implemented yet.
So I think AI is like a mirror. Through the mirror of AI, you can see the future of cryptocurrencies. Both of these tracks are currently supported by the US government, and both the Democratic and Republican parties are supporting them. I really can't think of any negative news that can fight against the government machinery other than economic recession. But at least BTC has not experienced a collapse, and investors still maintain enough patience.
Looking back at the current data, the start of the week saw BTC's trading volume still very low, with a large number of investors still in a wait-and-see mode. This state is increasingly resembling the two garbage times that have occurred before. The definition of garbage time is when nobody wants to buy or sell, and everyone is waiting for a better opportunity. However, as long as the current support level holds for BTC, investor sentiment remains assured.
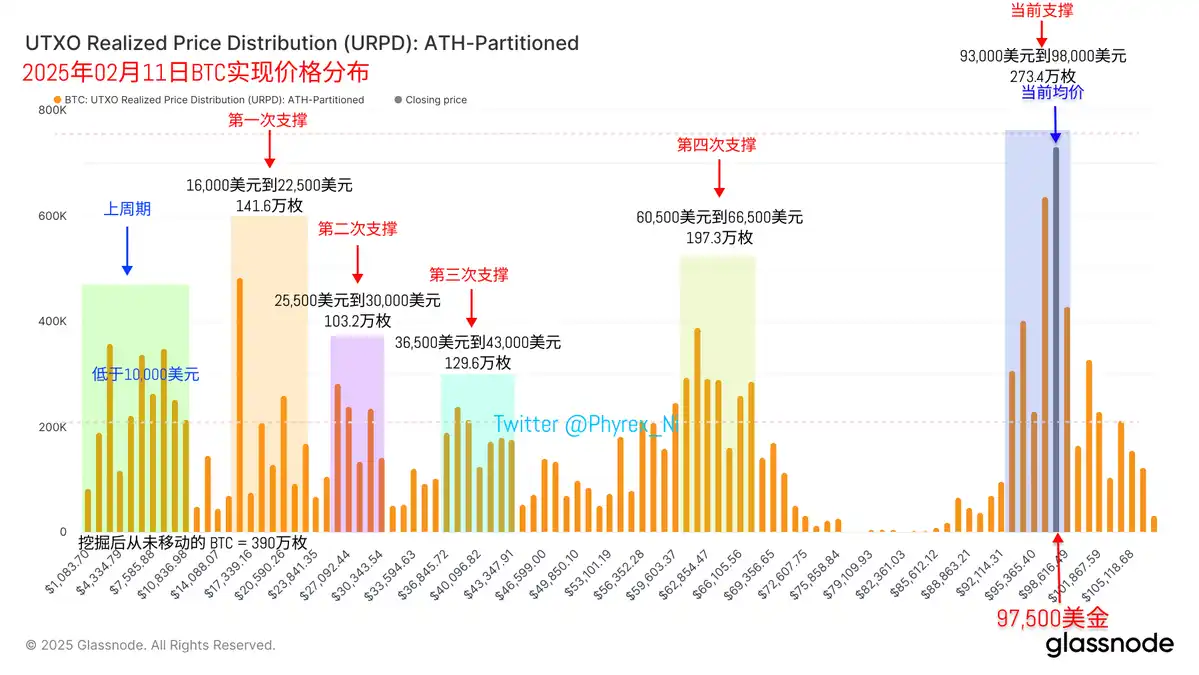
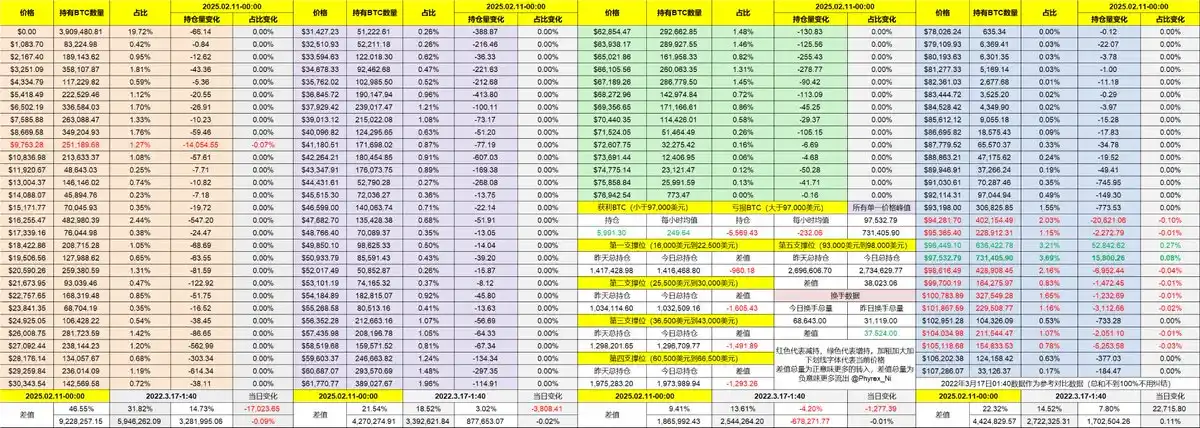
The support between $93,000 and $98,000 is still strong, and there are no signs of trouble for now. Moreover, recent BTC has been oscillating around $97,000, which may not necessarily be a bad thing. After shaking out the weak hands, it will be more beneficial for the future market.
Data Analysis
@Xbt886
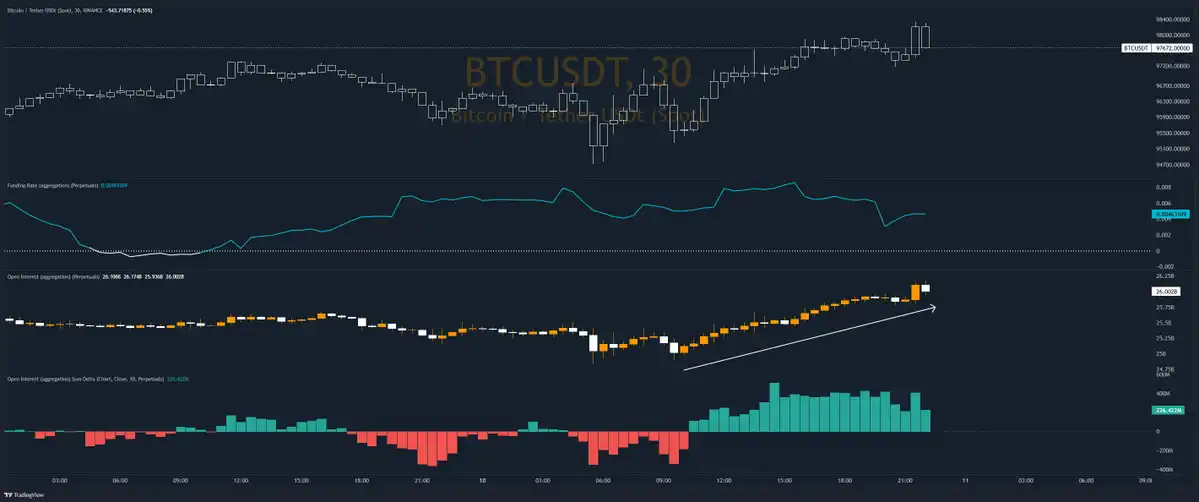
Futures longs are chasing the price to open positions, and a rise led by futures is often unsustainable.
@Phyrex_Ni
Although ETH's data is not very positive, BTC's data is slightly more optimistic. At least BTC still maintains a net inflow state, with both BlackRock and Fidelity seeing small-scale inflows. Investor sentiment towards BTC is still stronger than that towards ETH. The only significant sell-offs are from Grayscale's GBTC and VanEck's combined sale of 516 BTC, which is not substantial.
In fact, from the current perspective, whether it is BTC or ETH, the buying power is not strong without new positive catalysts. The buyer's market can only maintain a very scattered state. When there is good news, although the temporary buying volume data looks good, user sentiment deteriorates rapidly, making it challenging to sustain a continuous bullish trend. The issue may lie in the current poor liquidity.
The data for BTC spot ETF in the 56th week is also not favorable. Compared to the 55th week, US investors' net buying power is only 38%, down by 62%. It is also a decline compared to the 55th week versus the 54th week. Therefore, it is clear that investor sentiment in the last three weeks has not entered a FOMO state, naturally providing less support for the price.
However, it is still evident that more investors are still expecting BTC to have a better upward trend, especially since the new US government is still very supportive of cryptocurrency.

欢迎加入律动 BlockBeats 官方社群:
Telegram 订阅群:https://t.me/theblockbeats
Telegram 交流群:https://t.me/BlockBeats_App
Twitter 官方账号:https://twitter.com/BlockBeatsAsia


