Summary
Since its inception in 2009, Bitcoin has experienced five important price peaks. To date, the cryptocurrency has hit an all-time high of around $64,000 and is seeing increasing mainstream adoption. The entire process has its ups and downs, often influenced by political, economic and regulatory activities.
Bitcoin’s average annual growth rate is as high as 200%. As of August 2021, Bitcoin's market value is approximately US$710 billion, accounting for almost half of the entire cryptocurrency market.
Events such as the 2014 Mt. Gox trading platform hack and the 2020 stock market crash can explain some short- and medium-term price behavior. Over the long term, you can look at technical analysis, fundamental analysis, and sentiment analysis models to gain insights at a macro level.
At the level of technical analysis, Bitcoin’s logarithmic growth curve and super wave theory deserve attention. The superwave theory also links prices to investor sentiment by cyclical phases. At the level of fundamental analysis, the stock-to-flow ratio model and the Metcalfe model can closely track the price of Bitcoin. Ultimately, you can combine all these methods to arrive at a comprehensive and comprehensive judgment.
Introduction
Since its inception in 2009, the value of Bitcoin (BTC) has surged, attracting The eyes of the world. However, Bitcoin is not synonymous with a bull market, nor does it allow investors to make profits without losing money. It has also experienced declines and bear markets. Despite its ups and downs, cryptocurrencies have outperformed all traditional assets so far. Bitcoin price history is composed of a variety of factors that can be studied through different techniques and perspectives.

How to analyze Bitcoin’s price history
Begin studying the data First, let’s take a look at how to analyze Bitcoin’s price history. There are three analysis methods: technical analysis, fundamental analysis and sentiment analysis. Each method has its own advantages and disadvantages, and different methods can be combined to form a clearer concept.
1. Technical Analysis (TA): Consider historical price trends and trading volume data to try to predict future market trends. For example, you can average prices over the past 50 days to create a 50-day simple moving average (SMA). You can draw SMA on an asset price chart to make predictions about the asset. For example, let’s say Bitcoin has been trading below the 50-day moving average for several weeks and then breaks above that line. This change could signal an imminent price recovery.
2. Fundamental Analysis (FA): Uses data that represents the underlying intrinsic value of a project or cryptocurrency. This type of research focuses on determining the actual value of an asset through internal and external factors. For example, you can look at Bitcoin's daily transactions to gauge how popular the network is. If this number increases over time, it indicates that the item has some value and the price may increase.
3. Sentiment Analysis (SA): Use market sentiment to predict price movements. Market sentiment includes investors’ feelings and emotions about an asset. These sentiments can generally be classified as "bullish" or "bearish." For example, a significant increase in Google Trends searches for buying Bitcoin could indicate positive sentiment in the market.
What factors affected early Bitcoin transactions?
Next, we explore the factors that influence transactions and prices. These factors have changed over time since the inception of Bitcoin. In 2009, Bitcoin was still a very niche asset with extremely low liquidity. Users of BitcoinTalk and other forums see the value of Bitcoin as a decentralized currency and trade Bitcoin over the counter (OTC). Today's large-scale Bitcoin speculators were not yet a phenomenon at that time.
Satoshi Nakamoto mined the first block on January 3, 2009 and received a reward of 50 Bitcoins. Nine days later, he sent 10 Bitcoins to Hal Finney in the first ever Bitcoin transaction. By May 22, 2010, the unit price of Bitcoin was still less than $0.01. The world's first Bitcoin commercial transaction was also completed on that day, when Laszlo Hanyecz used 10,000 Bitcoins to purchase two pizzas. At the time, users on the Bitcointalk forum thought the transaction was unheard of and a novelty. This transaction contrasts with how Bitcoin is used today. Now you can easily purchase daily necessities using your Binance Visa Card.
As the price and popularity of Bitcoin continue to rise, some unregulated niche areas have begun to participate and actively drive trading volume. Typical examples include cryptocurrency trading platforms and darknet markets. If these markets and trading platforms are hacked, shut down, or regulated, the price of Bitcoin will often be significantly affected. Several trading platforms that supply large amounts of Bitcoin have been hacked, resulting in sharp price fluctuations and a lack of market confidence. We will explore this topic in depth later in the article.
What factors affect current Bitcoin transactions?
Bitcoin now has more in common with traditional assets than it did in its early days. Acceptance in the retail, financial and political sectors continues to grow, as do the factors that influence Bitcoin prices and transactions. Institutional investment in virtual currencies is also growing, increasing the influence of speculation. There are various signs that the factors affecting Bitcoin transactions have changed now compared with the early stages. We’ll discuss a few of the most influential factors below.
1. Compared with Bitcoin’s early development stages, today’s regulations are more stringent. As governments gain greater understanding of cryptocurrencies and blockchain technology, investment in controls and regulations tends to increase. Tightening or loosening regulations will have different effects. The price changes of Bitcoin are partly related to the ban on the circulation of Bitcoin in one country or its popularity in another country.
2. Global economic conditions will now also directly affect Bitcoin prices and transactions. For example, people living in inflationary countries have turned to cryptocurrencies to hedge against the risk of inflation. Venezuela entered an economic crisis in 2016, and as a result, the country’s fiat currency, the bolivar, hit a new volume high on LocalBitcoins. The 2020 stock market crash set off a Bitcoin bull market that lasted for more than a year. Today, Bitcoin, like gold, is a recognized means of storing value. People buy these assets when there is little confidence in the rest of the economy.

3. Large companies gradually accept Bitcoin, which may trigger price increases. Paypal, Square, Visa and Mastercard have all expressed support for cryptocurrencies to a certain extent, bringing confidence to investors. Retailers have even begun accepting Bitcoin payments. Removing support can also trigger a sell-off, such as when Elon Musk announced on May 17, 2021 that Tesla would stop accepting Bitcoin payments. As soon as the news came out, Bitcoin fell from just under $55,000 to about $48,500 that day.

4. The increase in speculative activities and derivatives such as Bitcoin contracts has driven additional demand in the market. In the contract market, traders and speculators do not invest in and hold Bitcoin because of its fundamental value. They simply profited by shorting Bitcoin, causing downward pressure on the price. The above facts show that utility is no longer the only factor that determines the price of Bitcoin.
Bitcoin Price History
Since its inception in 2009, the price of Bitcoin has fluctuated significantly. The above factors all have an important impact on the entire change process. Despite its ups and downs, Bitcoin’s price has indeed increased significantly compared to its early days.
If you compare Bitcoin to the Nasdaq 100 and gold, you will find that it far outperforms these two assets that have been performing strongly. You can also see its volatility - Bitcoin also has a higher annual loss ratio than gold or the Nasdaq 100 (Source: @CharlieBilello).
2011 | 2012 | 2013 | 2014 | 2015 | 2016 | 2017 | 2018 | 2019 | 2020 | |
Bitcoin | 1473% | 186% | 5507% | -58% | 35% | 125% | 1331% | -73% | 95% | 301% |
Gold | 9.6% | 6.6% | -28.3% | -2.2% | -10.7% | 8.0% | 12.8% | -1.9% | 17.9% | 24.8% |
NASDAQ 100 Index | 3.4% | 18.1% | 36.6% | 19.2% | 9.5% | 7.1% | 32.7% | -0.1% | 39.0% | 48.6% |
According to data from CaseBitcoin, Bitcoin’s 10-year compound annual growth rate (CAGR) is 196.7%. This metric takes compound interest into account and measures an asset's annual growth rate. Bitcoin has experienced four important price peaks, rising from $1 in 2011 to $65,000 in May 2021, setting a new all-time high. Throughout the history of Bitcoin, we break it down into five different peaks.

1. June 2011: Previous year’s prices Measured in just cents, it quickly rose to $32 at this time. Bitcoin experienced its first bull run, followed by a modest decline to $2.10.
2. April 2013:The price was about $13 at the beginning of the year, and then experienced the first bull market of the year, rising to $260 on April 10, 2013. Over the next two days, the price plummeted to $45.
3. December 2013:By the end of that year, Bitcoin had risen nearly 10 times between October and December. In early October, Bitcoin was trading at $125 before climbing to a peak of $1,160. By December 18, the price plummeted again to $380.
4. December 2017:The starting price in January 2017 was approximately $1,000. By December 17, 2017, Bitcoin quickly rose to just under $20,000. This bull run has solidified Bitcoin’s position in the mainstream market and attracted the attention of institutional investors and governments.
5. April 2021:The stock and cryptocurrency market crash in March 2020 caused prices to continue to rise, reaching as high as $63,000 by April 13, 2021. The COVID-19 epidemic has caused an unstable economic situation, and Bitcoin is regarded by some as a means of saving value. In May 2021, the Bitcoin and cryptocurrency markets experienced a significant sell-off, and prices have remained stagnant since then.

Short-term price activity
We will use it later Fundamental and technical analysis models are of limited effectiveness and cannot interpret all price action encountered. External factors such as political and economic activities also have a significant impact and can be analyzed separately. A more interesting example is the famous hacker attack in the early days of Bitcoin's development.
Mt. Gox trading platform hacking attack
The Mt. Gox Bitcoin trading platform hacking attack was a major event in 2014, causing a temporary drop in the price of Bitcoin. At the time, the Tokyo-based cryptocurrency exchange dominated the market, accounting for about 70% of the total Bitcoin supply. Since its inception in 2010, Mt. Gox has been the victim of hacker attacks, but has still managed to survive.
However, a hacker attack in 2014 stole approximately 850,000 Bitcoins, and most of the trading platform’s digital assets disappeared without a trace. Mt. Gox suspended withdrawals on February 14, 2014, causing Bitcoin, which had been trading at $850 for most of the week, to fall to around $680, a drop of approximately 20%.
In the end, hackers stole $450 million in user funds and Mt. Gox declared bankruptcy. Some former users claimed that the site did not fix coding issues in a timely manner. To this day, the reasons behind the hacker attack are still unclear, resulting in multiple legal proceedings against Mark Karpel's CEO of this trading platform that have not yet been concluded.
How do we explain Bitcoin’s long-term price history?
In the long run, small, insignificant events have little impact on prices. Therefore, it also makes sense to look for other ways to interpret Bitcoin's overall positive trajectory. One approach is to look at models that use the techniques mentioned above for analysis.
Fundamental analysis: Stock-to-flow ratio model
The stock-to-flow ratio model uses the limited supply of Bitcoin as a potential price indicator. At a fundamental level, Bitcoin is somewhat similar to gold or diamonds. Over time, the prices of these two scarce commodities continue to rise. This factor drives investors to use it as a means of saving value.
This ratio can be calculated by dividing the total global circulating supply (inventory) by the total production (in circulation) for the year, modeling the change in the price of Bitcoin over time. We know the exact number of new Bitcoins produced by miners and the approximate time when these new Bitcoins are received. In short, the returns from mining continue to decline, causing the stock-to-flow ratio to increase.
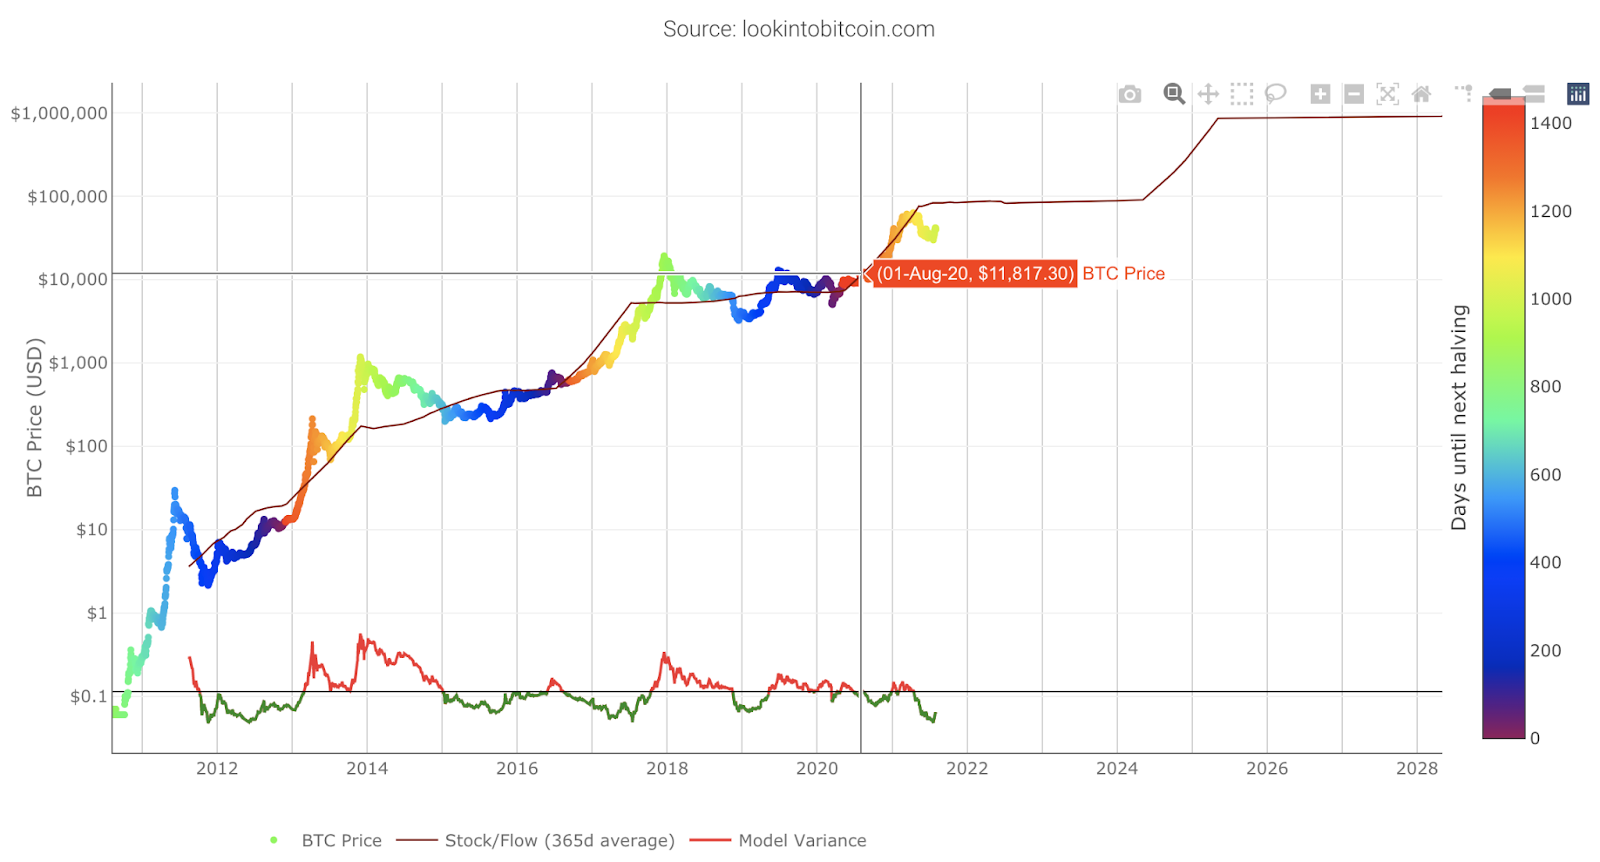
To date, the stock-to-flow ratio continues to accurately model Bitcoin’s price history and is favored by the market. The chart below shows the 365-day moving average (SMA) and Bitcoin’s historical price data and the model’s predictions for the future.

Of course, this model also has shortcomings. As time goes by and the circulating supply of Bitcoin drops to zero, the model can only collapse because zero cannot be used as a divisor. This method of calculation yields mind-boggling price predictions that tend toward infinity. Please read our article Bitcoin and Stock-to-Flow Ratio Model to learn more about the pros and cons of stock-to-flow ratios.
Fundamental Analysis: Metcalfe’s Law
Metcalfe’s Law is a general operating principle that can also be applied to Bitcoin network. It states that the value of a network is proportional to the square of the number of connected users. What does this mean? Let's use an easy-to-understand example of the telephone network. The more people who have a phone, the more valuable the network becomes.
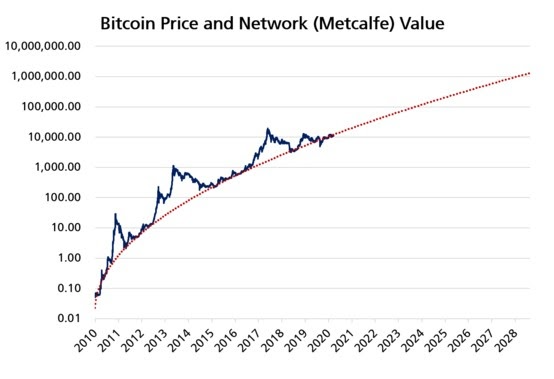
For Bitcoin, the Metcalf value can be calculated by using the number of active Bitcoin wallet addresses and other public information in the blockchain. If you plot the Metcalfe values against prices, the fit is quite good. As Timothy Peterson does in the chart below, you can also extrapolate trends and predict future prices.

The Network Value to Metcalfe (NVM) ratio is another use of Metcalfe's Law. This ratio is calculated by dividing Bitcoin's market capitalization by a formula that approximates Metcalfe's Law. The formula uses the number of unique addresses active on a specific day as a proxy for network users. The definition of "unique address" is: an address that has a balance and has conducted transactions on that day.
A value above 1 indicates that the market is overvalued, while a value below 1 indicates that the market is undervalued. You can get a visual idea of its status based on the chart below from Cryptoquant. The left axis is the NVM ratio and the right axis is the network value.

Technical analysis: Bitcoin’s logarithmic growth curve
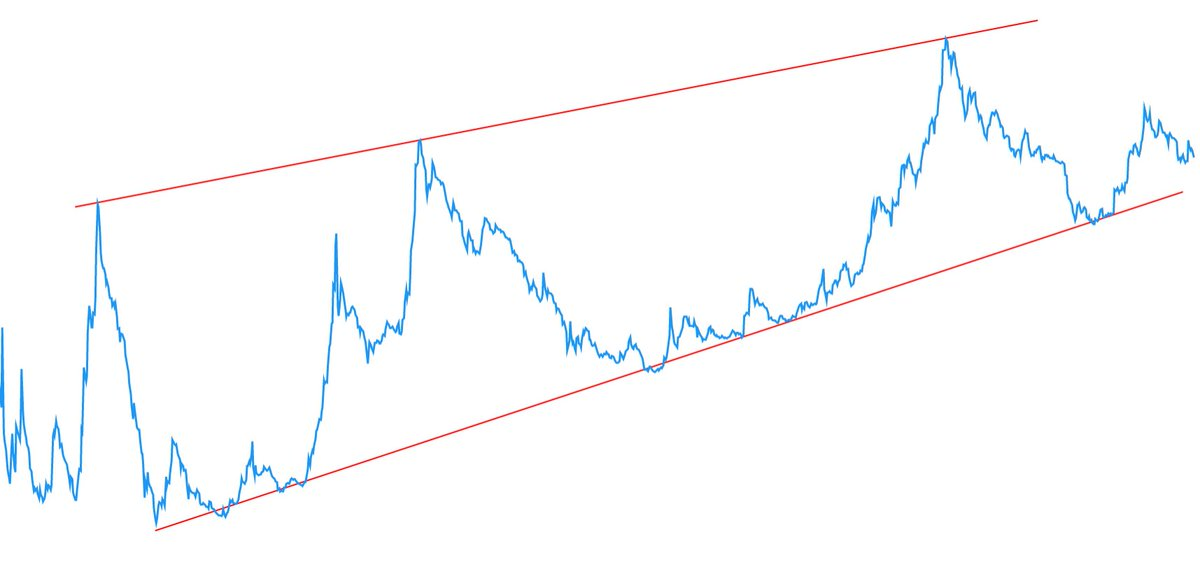
Bitcoin’s logarithmic growth curve is Technical analysis model established by Cole Garner in 2019. A standard Bitcoin price chart shows log price versus linear time (x-axis). If time is also recorded, a simple trendline can be drawn matching the tops of the last three bull markets and Bitcoin market support.

These trend lines can be converted back to the original logarithmic price chart, showing a growth curve. As shown in the LookIntoBitcoin.com chart below, the curve currently matches Bitcoin’s price history fairly well.

Technical Analysis: Super Wave Theory
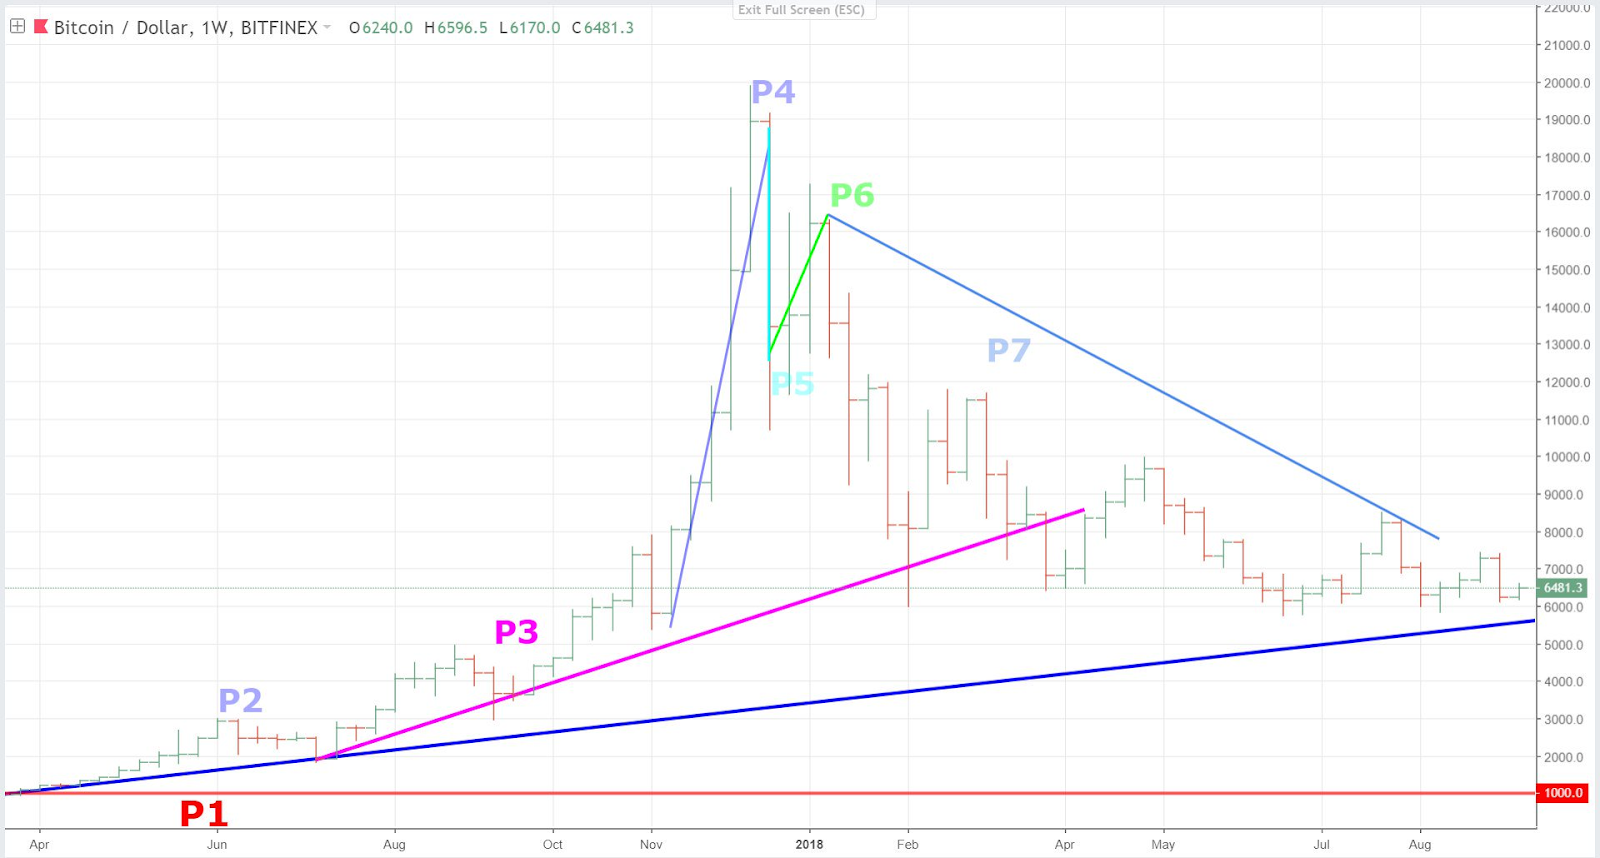
Super Wave Theory was proposed by Tyler Jenks in an attempt to pass investors Sentiment explains price action. The theory is that market sentiment fluctuates between pessimism and optimism. These sentiments often lead to superwaves, where prices climb higher over time and then reverse into a bear trend. While Jenks theorizes that the pattern stems from market sentiment, the chart only uses technical analysis of price data to draw trend lines. According to the super wave theory, the market cycle is divided into seven stages.

In stages 1, 5 and 7, the asset price should remain below the resistance line. During stages 2, 3, 4 and 6, the price should remain above the support line. Of course, some assets will not fully adhere to this rule, but there is evidence that some markets do fit this pattern. In the chart below, Leah Wald (CEO of Valkyrie Investments Inc.) outlines the Nasdaq Composite Index in 2000.

Let’s take a look at the Bitcoin bull market in 2017. After applying the trend of super wave theory, we found that except for the first stage, the fitting degree of the upper and lower images is relatively high. In addition, it can be seen that the price growth rate is getting faster and faster, and then it begins to develop according to the rules of the above stages, resulting in a large-scale collapse.

Conclusion
Obviously, many theories have attempted to explain Bitcoin’s price history. Whatever the answer, Bitcoin’s nearly 200% 10-year compound annual growth rate (CAGR) has demonstrated the digital currency’s astonishing rise. Even in the field of cryptocurrency, as of August 2021, Bitcoin's market value has reached approximately US$710 billion, accounting for almost half of the entire market.
The reasons behind this huge growth include cryptocurrency fundamentals, market sentiment and economic activity. However, past performance is not indicative of future results. Understanding why Bitcoin has such a high price trajectory does help, but it doesn’t accurately predict the future. Looking at its development history, as a new asset class with only a short history of 12 years, Bitcoin has developed quite well.
 Forum
Forum OPRR
OPRR Finance
 Specials
 On-chain Eco
 Entry
Entry
 Podcasts
 Data
Data
