Contents
- What is the inventory to flow ratio model?
- What is gold’s stock-to-flow ratio?
- Stock-to-flow ratio and Bitcoin
- What is Bitcoin’s stock-to-flow ratio?
- Limitations of the inventory-to-flow ratio model
- Summary
What is the inventory to flow ratio model?
Simply put, the stock-to-flow ratio (SF or S2F) model is a method of measuring the abundance of a specific resource. The stock-to-flow ratio is derived by dividing the amount of resources held in reserves by the annual production quantities.
The stock-to-flow ratio model is generally applicable to natural resources. Let’s take gold as an example. While estimates may vary, the World Gold Council estimates that approximately 190,000 tons of gold have been mined. This quantity (i.e. total supply) is what we call inventory. At the same time, approximately2,500-3,200 tonsof gold are mined annually. This amount is what we call traffic.
We can use these two indicators to calculate the inventory to flow ratio. But what does this ratio actually mean? It basically shows how much supply of a given resource phase enters the market each year against the total supply. The higher the stock-to-flow ratio, the less new supply is entering the market relative to total supply. So in theory, assets with higher stock-to-flow ratios should retain their value over the long term.
In contrast, consumer and industrial goods typically have lower stock-to-flow ratios. Why is this happening? Generally speaking, the value of these goods is usually destroyed or depleted, so inventory (inventory) is usually just to satisfy demand. These resources do not necessarily have high value as property and therefore are often not suitable assets for investment. In some exceptional cases, prices may rise rapidly if future shortages are anticipated, otherwise production would continue to be based on demand.
It is important to note that scarcity alone does not necessarily mean that a resource should be valuable. For example, gold is not that scarce, after all, we have 190,000 tons to work with! The reason the stock-to-flow ratio suggests it is valuable is because its annual production is relatively small and stable compared to existing inventories.
What is the stock-to-flow ratio of gold?
Historically, gold has the highest stock-to-flow ratio among precious metals. So how much is it? Let's go back to the previous example: we divide the total supply of 190,000 tons by 3,200, which gives us a stock-to-flow ratio of about 59 for gold. This tells us that at current production rates, it would take approximately 59 years to mine 190,000 tons of gold.
But it’s also important to note that estimates of how much new gold is mined each year are only estimates. If we increase annual production (flow) to 3,500 tons, the stock-to-flow ratio decreases to approximately54.
Now that we have talked about it, why not calculate the total value of all the gold that has been mined? In a way, this can be compared to the market capitalization of cryptocurrencies. If we put the price of gold per troy ounce at approximately $1,500, then the total value of all gold is approximately $9 trillion. This sounds like a lot, but in reality, if you packed all the gold into a cube, a football field would be enough to hold the cube.
Similarly, the highest total value of the Bitcoin network was approximately $300 billion at the end of 2017, and remains around $120 billion at the time of writing.
Stock-to-flow ratio and Bitcoin
It’s not hard to understand if you know how Bitcoin works What it means to apply a stock-to-flow ratio for Bitcoin. Basically, this model treats Bitcoin like a scarce commodity like gold or silver.
Gold and silver are often referred to as resources that have a store of value. In theory, their relative scarcity and low traffic should hold their value over the long term. More importantly, their supply is difficult to increase significantly in a short period of time.
Proponents of the stock-to-flow ratio argue that Bitcoin is a similar resource. It is extremely scarce, has relatively high production costs, and its maximum supply is capped at 21 million coins. Additionally, Bitcoin’s supply issuance is defined at the protocol level, so we can fully predict traffic. You may also have heard about Bitcoin halvings, where the new supply entering the system is cut in half every 210,000 blocks (approximately every four years).

Total mined BTC supply (%) and area Block Subsidy (BTC).
Proponents of this model argue that these attributes combine to create a scarce digital resource that is characterized by being highly attractive and available Long-term value preservation. Furthermore, they also hypothesized a statistically significant relationship between stock-to-flow ratio and market value. According to this model’s predictions, Bitcoin’s price should rise significantly over time as Bitcoin’s stock-to-flow ratio continues to decrease.
The application of the stock-to-flow ratio model to Bitcoin can often be attributed to PlanB, and his article Modeling the Value of Bitcoin Based on Scarcity.
What is Bitcoin’s stock-to-flow ratio?
The current circulating supply of Bitcoin is approximately 18 million Bitcoins, and the new supply is approximately 700,000 Bitcoins each year. At the time of writing, Bitcoin’s stock-to-flow ratio is around 25. After the next halving in May 2020, this ratio will rise to the early 50s.
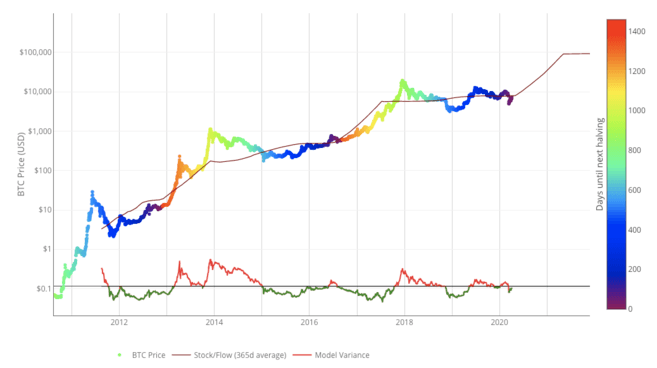
In the chart below, you can see the historical relationship between Bitcoin’s stock-to-flow ratio’s 365-day moving average and its price. We also plot the date of the Bitcoin halving on the vertical axis.

Bitcoin’s stock-to-flow ratio model. Source: LookIntoBitcoin.com
Want to start your cryptocurrency journey? Buy Bitcoin on Binance today!
Limitations of the inventory-to-flow ratio model
h2>
While the stock-to-flow ratio is an interesting model for measuring scarcity, it is not perfect. Models are based solely on assumptions. On the one hand, stock-to-flow ratios rely on the assumption that scarcity, as measured by the model, should affect value. Critics of the stock-to-flow ratio say the model would be meaningless if Bitcoin didn’t have any practical properties other than supply scarcity.
Compared with fiat currencies that are prone to depreciation, gold has a relatively more stable store of value due to its scarcity, predictable flow and global liquidity.
According to this model, Bitcoin’s volatility should also decrease over time. Historical data from Coinmetrics confirms this.

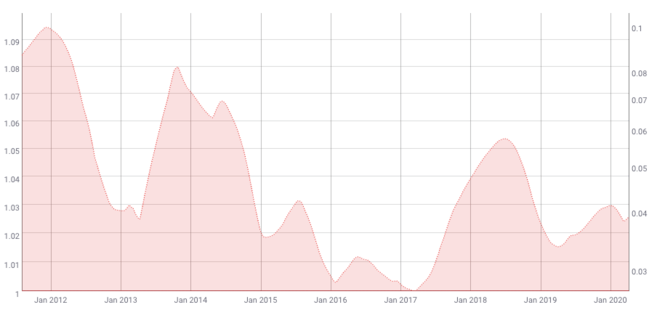
200-day move of Bitcoin’s 180-day volatility average line. Source: Coinmetrics.io
The valuation of an asset needs to take into account its volatility. If volatility is predictable to a certain extent, a valuation model is likely to be more reliable. However, Bitcoin’s price is notoriously volatile.
While Bitcoin’s volatility may be declining at a macro level, it has been priced in the free market since its inception. This means that prices will mostly be adjusted on the open market by users, traders and speculators. Given its relatively low liquidity, Bitcoin may be more susceptible to sudden increases in volatility than other assets. Therefore, this model cannot account for this situation either.
Other external factors, such as economic "black swan events", may also undermine this model. However, it is worth noting that any model that attempts to predict asset prices based on historical data will almost always have this shortcoming. "Black swan events" are obviously accidental factors. Historical data cannot explain unknown events.
Summary
The inventory-to-flow ratio model measures the relationship between a resource's currently available inventory and its productivity. It typically applies to precious metals and other commodities, but some believe it might apply to Bitcoin as well.
In this sense, Bitcoin can indeed be regarded as a scarce digital asset. According to this analysis, Bitcoin should be able to become an asset that retains its value in the long term due to its unique characteristics.
However, each model is built on assumptions, and it may not explain every aspect of Bitcoin valuation. What’s more, at the time of writing, Bitcoin is only a little over a decade old. Some might argue that long-term valuation models like stock-to-flow ratios require larger data sets in order to achieve more reliable accuracy.
 Forum
Forum OPRR
OPRR Finance
 Specials
 On-chain Eco
 Entry
Entry
 Podcasts
 Data
Data
